Map library · USA coins and relics

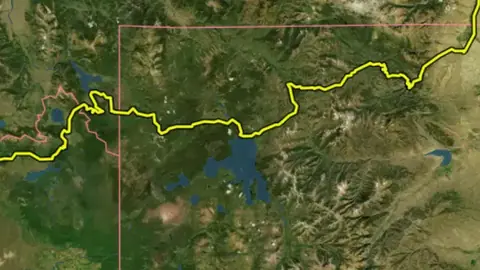
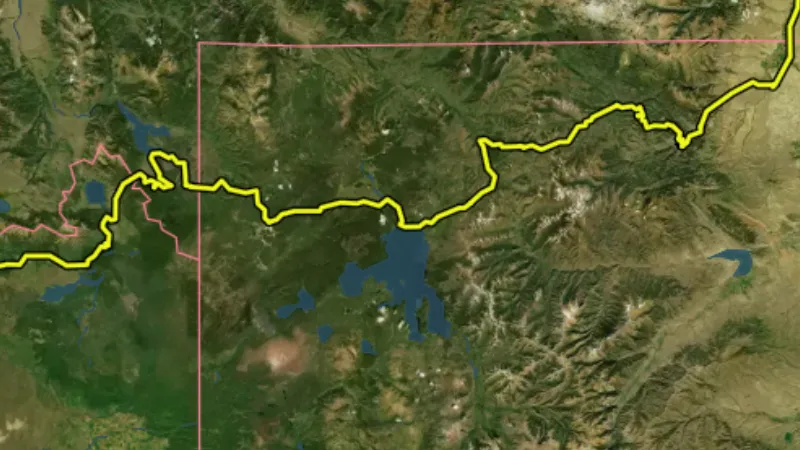
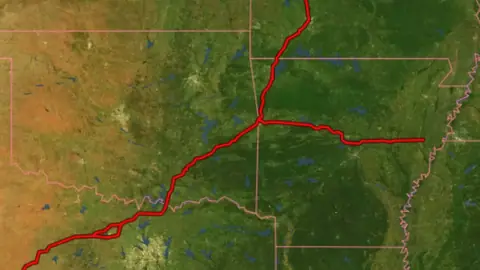
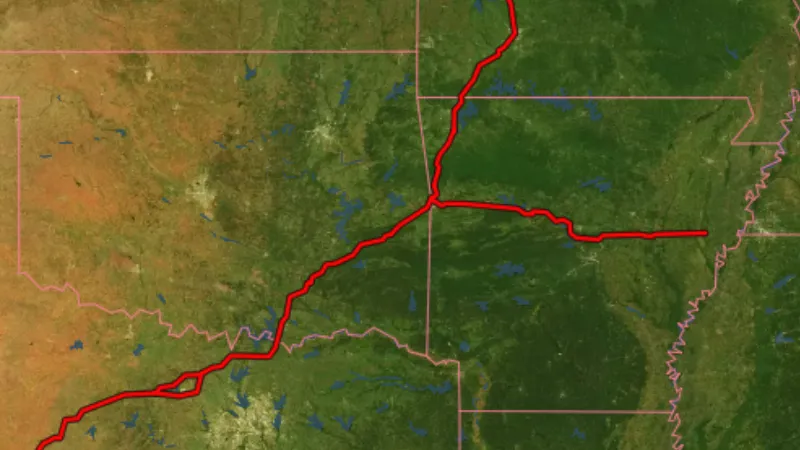
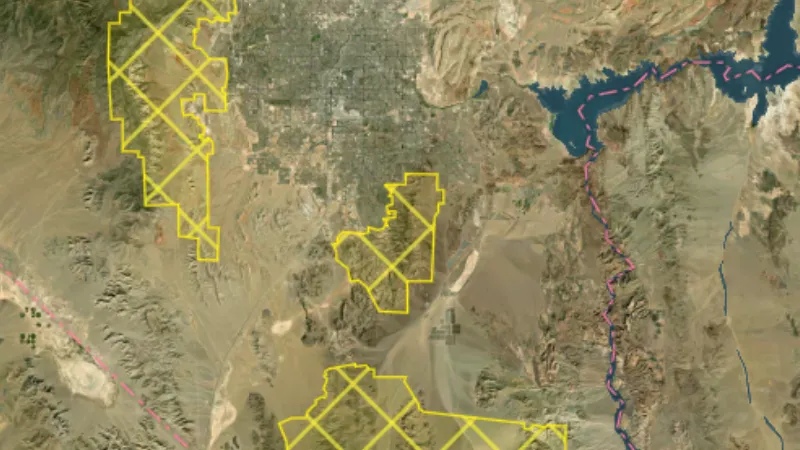
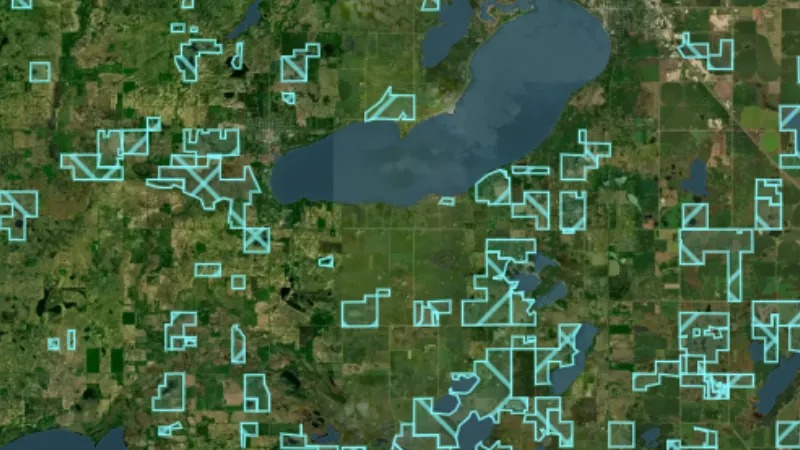
USA coin and relic map layers

Every layer on the nationwide map, with a picture, what it is for, its limits, its source and the plan that opens it. Start with the free ones.

45 layers for coin and relic detecting across the USA, in 12 categories. 2 are free on every plan: Ghost Towns and Historic Topo (by era). 40 more open with Explorer. 3 need Pro.

45 layers12 categoriesFree 2Explorer 40Pro 3

Switch map

On iPhone? Get it on the App StoreOn Android? Get it on Google Play

Free to download on iPhone and Android.

7-day free trial on yearly plans · Nothing charged until it ends · Cancel anytime.

Scan with your phone camera to get the app
Start free trialOpen the web map

On your phone: App Store · Google Play

7-day free trial on yearly plans · Nothing charged until it ends · Cancel anytime.

4.7 / 5 from 2,400+ ratings on the App Store and Google Play · 10,000+ prospectors and detectorists
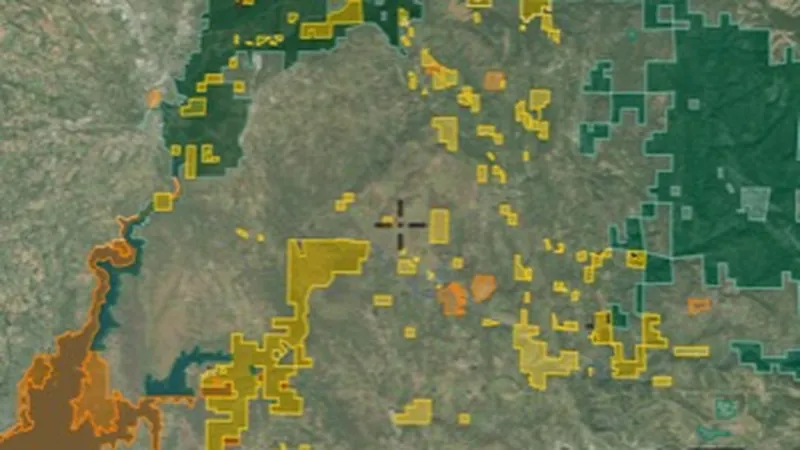
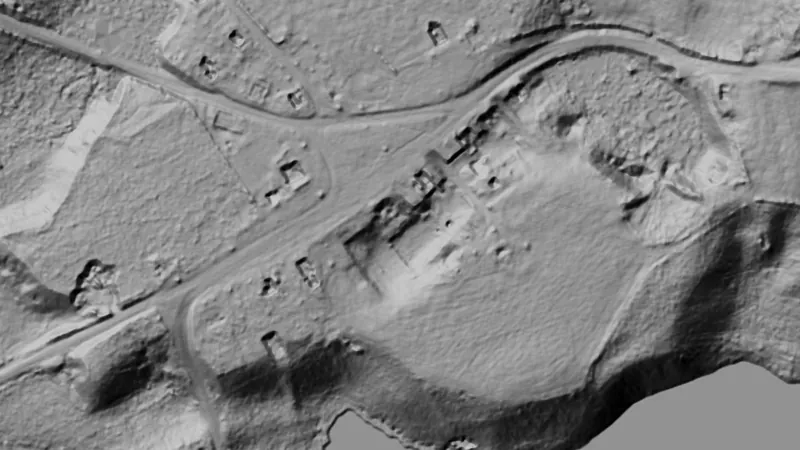
Dynamic LiDAR™ in USA coins and relics, drawn over satellite imagery© Mapbox, © Maxar

Satellite imagery © Mapbox, © Maxar. Layer data from the sources named on each card.

Satellite imagery © Mapbox, © Maxar. Layer data from the sources named on each card.

Historic Places

3
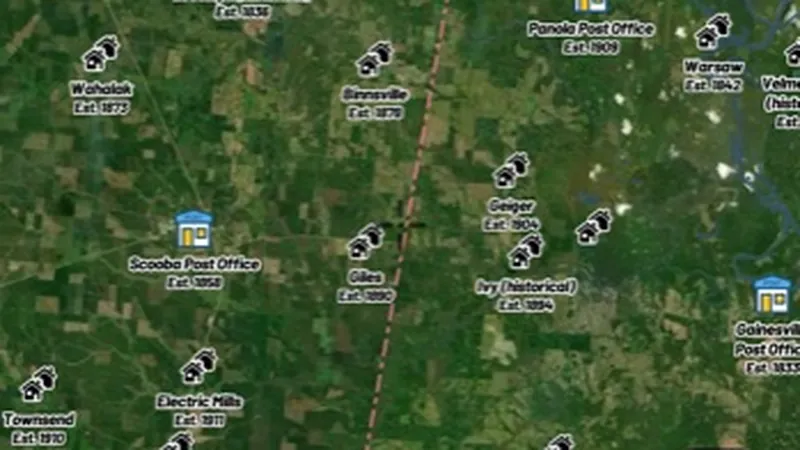
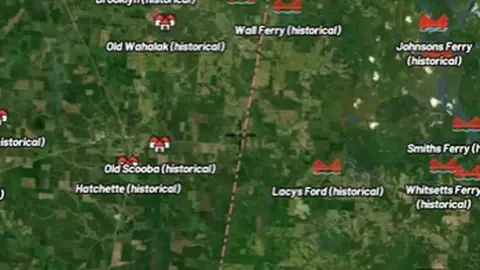
  • Ghost Towns in the Detector Maps app, USA coins and relics© Mapbox, © Maxar
    Historic PlacesFree

    Ghost Towns

    Historic towns and populated places from the USGS GNIS gazetteer.

    Read the write-up
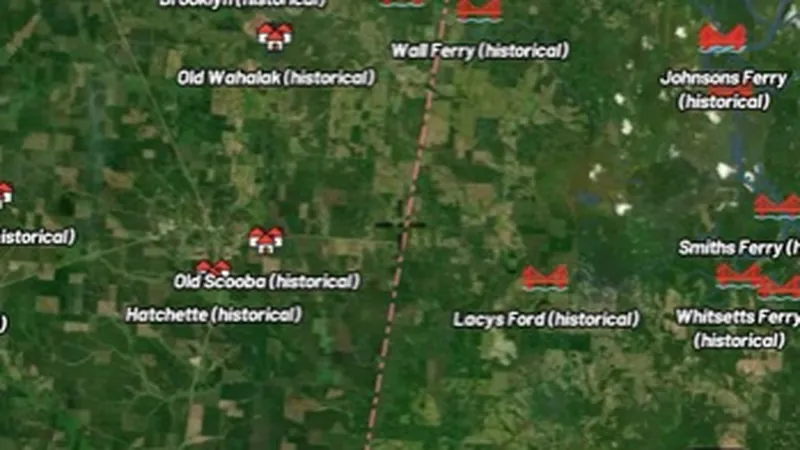
    Ghost Towns in the Detector Maps app, USA coins and relics© Mapbox, © Maxar

    A screen from the Detector Maps app. Satellite imagery © Mapbox, © Maxar.

    Free. Opens on every plan, including Free.

    Open in the app

    About this layer

    Ghost-town records identify places associated with former settlements. Compare the records with old maps, roads and terrain to understand the wider site. A historic settlement may now lie on private or protected land.

    What it is for

    Read the available record and compare its date, description and location with other historical sources.

    Limits

    Record locations may be generalised or approximate. Historic interest does not establish permission to detect or disturb a site.

    Source

    Data © USGS, BLM, USFWS, USFS; styling © Detector Maps™

    Legend

    Historic Places
    • Historic Established Places
    • Post Office
    • Populated Place
    • Cemetery
    • School
    • Church
    • Mine
    • Ghost Towns
    • Town
    • Military
    • Crossing
  • Historic Established Places in the Detector Maps app, USA coins and relics© Mapbox, © Maxar
    Historic PlacesExplorer

    Historic Established Places

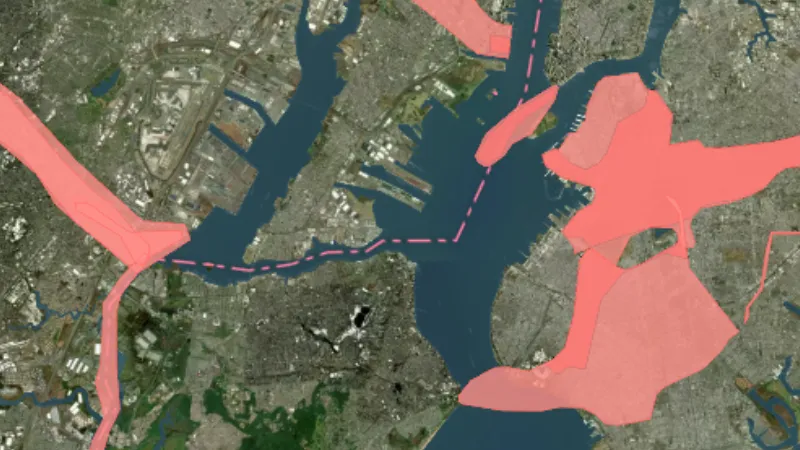
    Towns and places coloured by the era they were established. Toggle on, then use the slider to step through 25-year periods.

    Read the write-up
    Historic Established Places in the Detector Maps app, USA coins and relics© Mapbox, © Maxar

    A screen from the Detector Maps app. Satellite imagery © Mapbox, © Maxar.

    Explorer. Opens with Explorer or Pro. On the Free plan it works inside your one free area of 250 km².

    Open in the app

    About this layer

    Historic place records identify locations associated with earlier settlement or activity. Use the available dates and details to compare them with old maps. Some places still exist, while others have changed or disappeared.

    What it is for

    Read the available record and compare its date, description and location with other historical sources.

    Limits

    Record locations may be generalised or approximate. Historic interest does not establish permission to detect or disturb a site.

    Source

    Data © USGS, BLM, USFWS, USFS; styling © Detector Maps™

    Legend

    Historic Places
    • Historic Established Places
    • Post Office
    • Populated Place
    • Cemetery
    • School
    • Church
    • Mine
    • Ghost Towns
    • Town
    • Military
    • Crossing
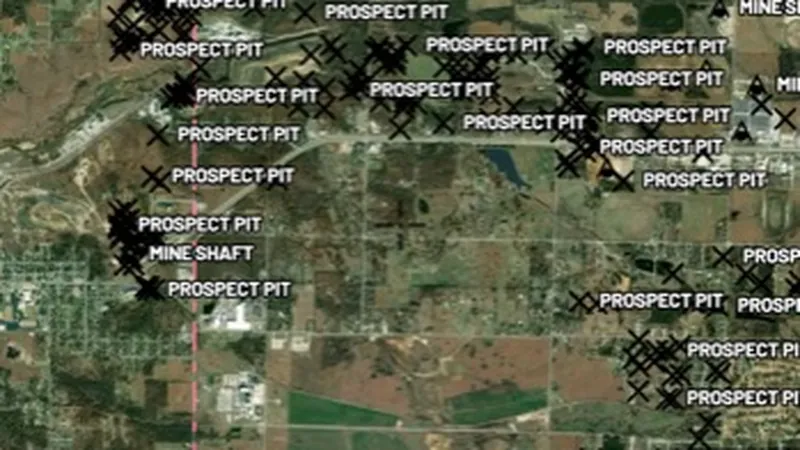
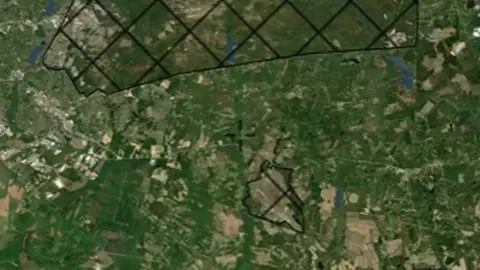
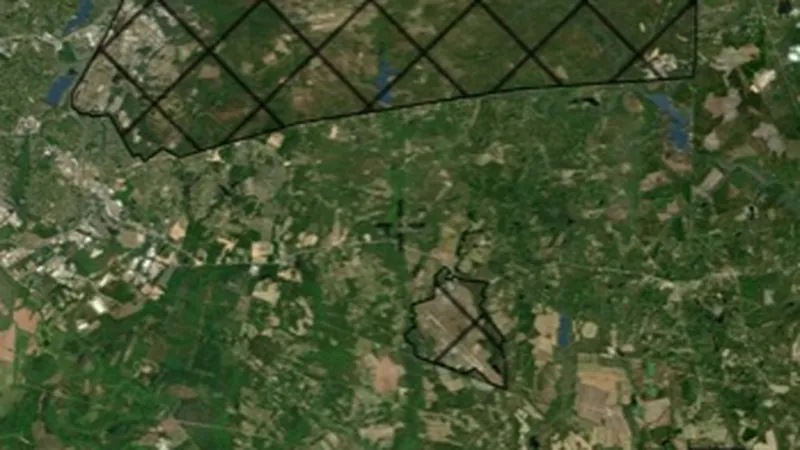
  • Historic Mine Locations in the Detector Maps app, USA coins and relics© Mapbox, © Maxar
    Historic PlacesExplorer

    Historic Mine Locations

    Mine and prospect symbols digitised from historic USGS topographic maps, useful for locating old workings and camps.

    Read the write-up
    Historic Mine Locations in the Detector Maps app, USA coins and relics© Mapbox, © Maxar

    A screen from the Detector Maps app. Satellite imagery © Mapbox, © Maxar.

    Explorer. Opens with Explorer or Pro. On the Free plan it works inside your one free area of 250 km².

    Open in the app

    About this layer

    These symbols were recorded on older topographic maps to mark mining features. They are useful clues to past workings, even when little is visible today. A map symbol does not confirm a working still exists or is safe to approach.

    What it is for

    Read the available record and compare its date, description and location with other historical sources.

    Limits

    Record locations may be generalised or approximate. Historic interest does not establish permission to detect or disturb a site.

    Source

    Data © USGS, BLM, USFWS, USFS; styling © Detector Maps™

    Legend

    Historic Mine Locations
    • Mine
    • Adit / Shaft
    • Prospect Pit
    • Tailings

Historic USGS Topo Maps

1
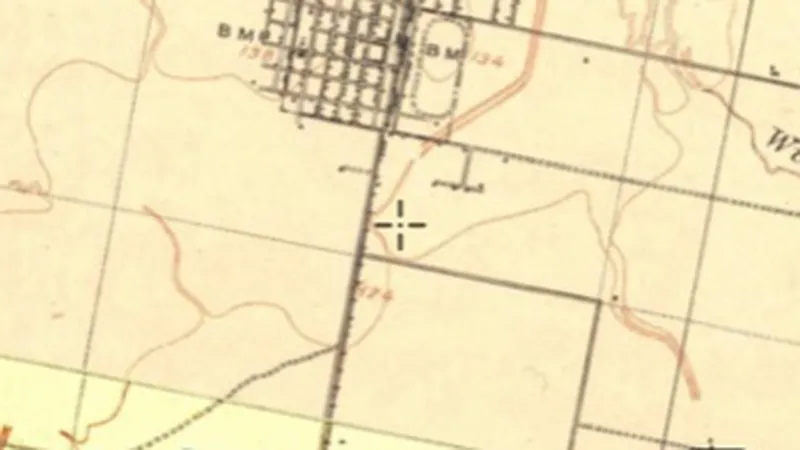
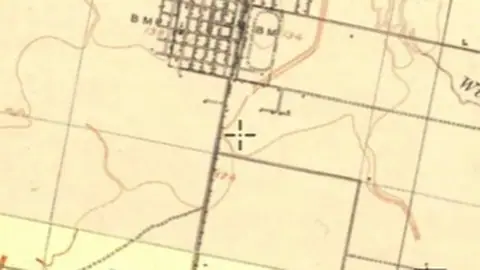
  • Historic Topo (by era) in the Detector Maps app, USA coins and relics© Mapbox, © Maxar
    Historic USGS Topo MapsFree

    Historic Topo (by era)

    Historical maps show how an area was recorded in an earlier period.

    Read the write-up
    Historic Topo (by era) in the Detector Maps app, USA coins and relics© Mapbox, © Maxar

    A screen from the Detector Maps app. Satellite imagery © Mapbox, © Maxar.

    Free. Opens on every plan, including Free.

    Open in the app

    About this layer

    Historical maps show how an area was recorded in an earlier period. Compare old roads, buildings, boundaries and workings with the modern basemap. Scans can be misaligned, and features may have moved or disappeared.

    What it is for

    Compare the old map with the modern basemap using opacity. Check the selected map or era before interpreting a feature.

    Limits

    Old maps can be stretched, incomplete or offset from modern coordinates. Treat locations as clues rather than exact positions.

    Source

    Data © USGS, BLM, USFWS, USFS; styling © Detector Maps™

    Legend

    Historic USGS Topo Maps
    Scanned historical USGS topo maps. Use the era slider to change the decade shown.
    • Topographic map

    Filters in the app

    Era filter

    Draws from zoom 0.

Shipwrecks

1
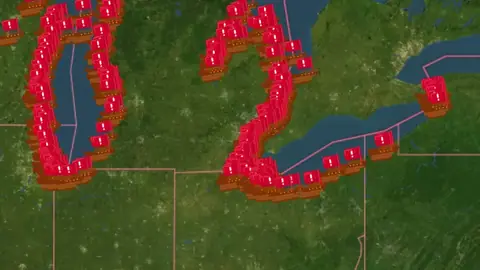
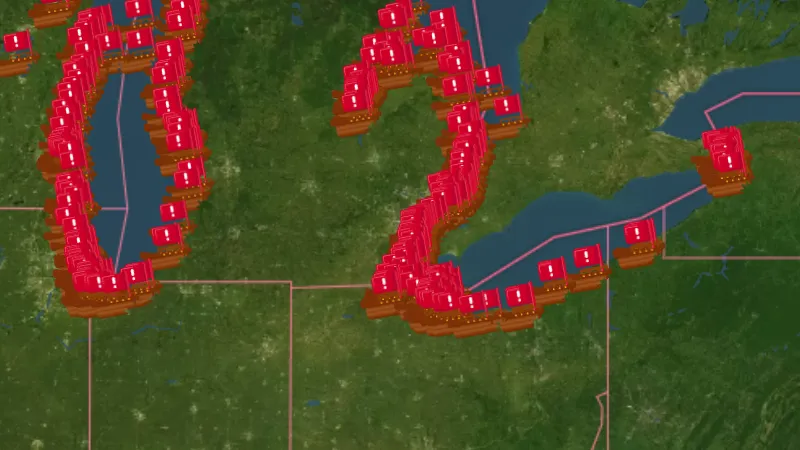
  • Shipwrecks in USA coins and relics, drawn over satellite imagery© Mapbox, © Maxar
    ShipwrecksExplorer

    Shipwrecks

    Shipwreck records identify reported wreck locations.

    Read the write-up
    Shipwrecks in USA coins and relics, drawn over satellite imagery© Mapbox, © Maxar

    The layer drawn over satellite imagery. Satellite imagery © Mapbox, © Maxar.

    Explorer. Opens with Explorer or Pro. On the Free plan it works inside your one free area of 250 km².

    Open in the app

    About this layer

    Shipwreck records identify reported wreck locations. They help you research maritime history and the surrounding waterways. Locations may be approximate, and wrecks can be protected or unsafe to approach.

    What it is for

    Read the record details and compare the reported location with other historical sources.

    Limits

    Reported positions can be approximate. This layer is not navigation advice or permission to access or recover material.

    Source

    Data © USGS, BLM, USFWS, USFS; styling © Detector Maps™

    Legend

    Shipwrecks
    Not for navigation.
    • Shipwreck

    Filters in the app

    Presence filter

Historical Heatmaps

10
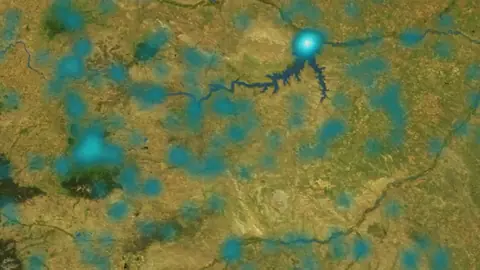
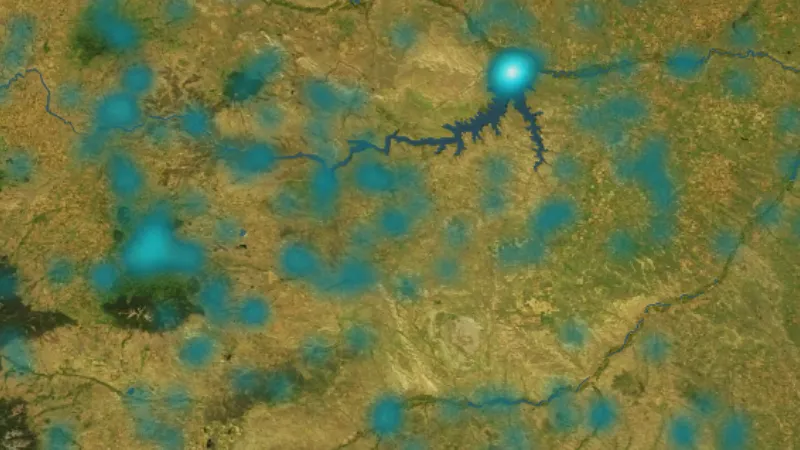
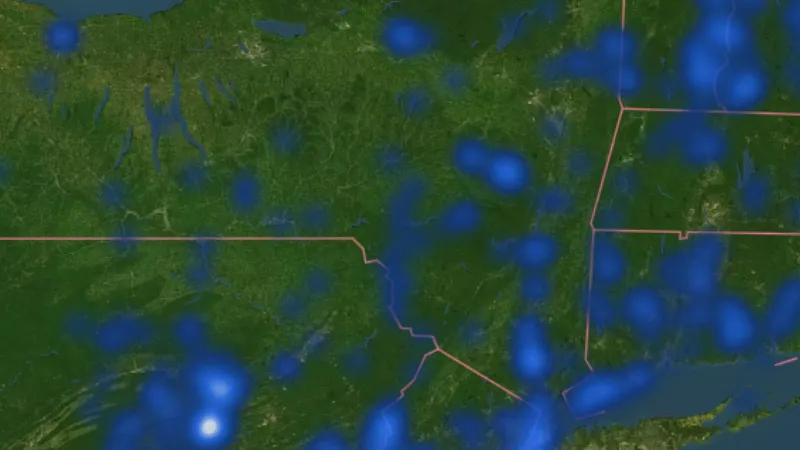
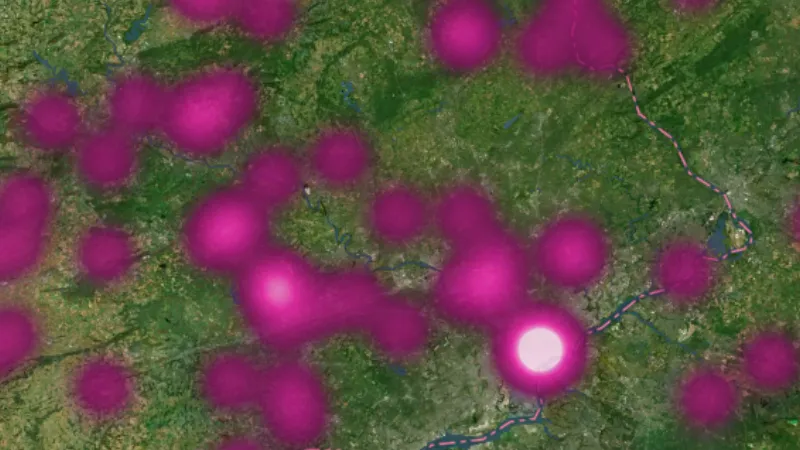
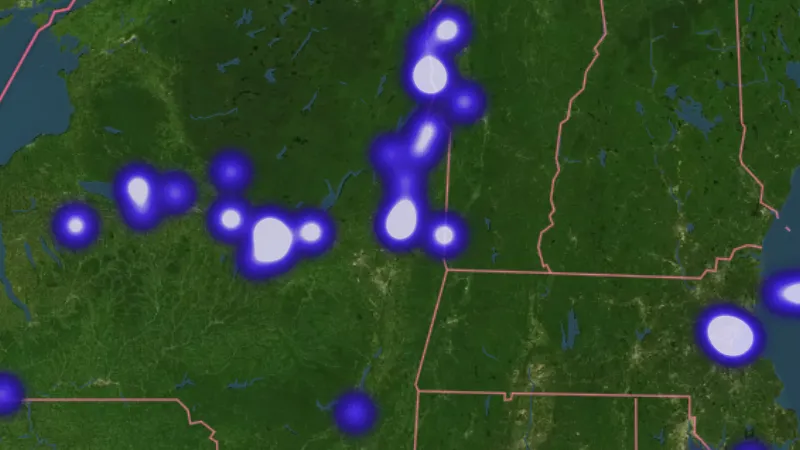
  • Ghost Towns in USA coins and relics, drawn over satellite imagery© Mapbox, © Maxar
    Historical HeatmapsExplorer

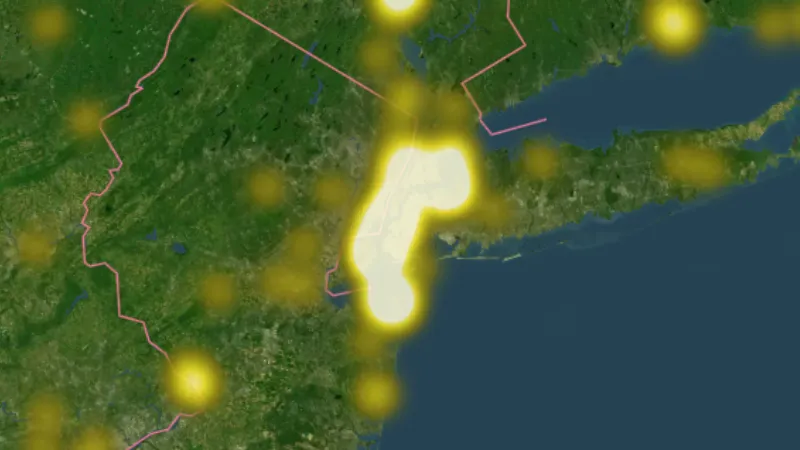
    Ghost Towns

    Ghost-town records identify places associated with former settlements.

    Read the write-up
    Ghost Towns in USA coins and relics, drawn over satellite imagery© Mapbox, © Maxar

    The layer drawn over satellite imagery. Satellite imagery © Mapbox, © Maxar.

    Explorer. Opens with Explorer or Pro. On the Free plan it works inside your one free area of 250 km².

    Open in the app

    About this layer

    Ghost-town records identify places associated with former settlements. The heat shading highlights concentrations of these recorded sites. Compare the individual records with old maps; stronger shading does not tell you how many objects remain.

    What it is for

    Read the legend and compare stronger and weaker concentrations with the individual records, where available.

    Limits

    A stronger colour can reflect more recording or surveying. It is not a count of finds still in the ground or an exact search location.

    Source

    Data © USGS, BLM, USFWS, USFS; styling © Detector Maps™

    Legend

    Historical Heatmaps
    Heat shows site concentrations when zoomed out; from zoom 11 the individual sites appear. Tap one for details.
    • Ghost Towns
    • Old Schools
    • River Crossings & Ferries
    • Homesteads & Plantations
    • Mills
    • Military (all)
    • Forts, Camps & Batteries
    • Civil War Battles
    • Revolutionary War Battles
    • War of 1812 Battles
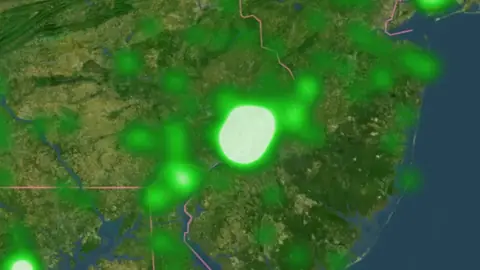
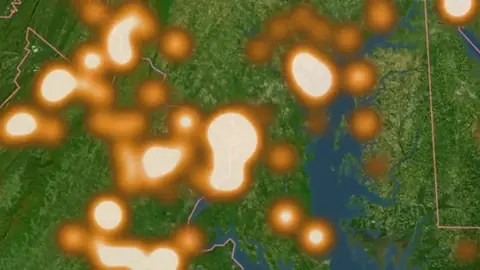
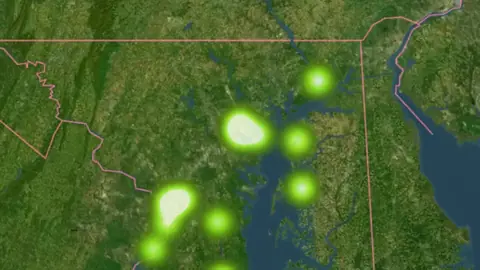
  • Old Schools in USA coins and relics, drawn over satellite imagery© Mapbox, © Maxar
    Historical HeatmapsExplorer

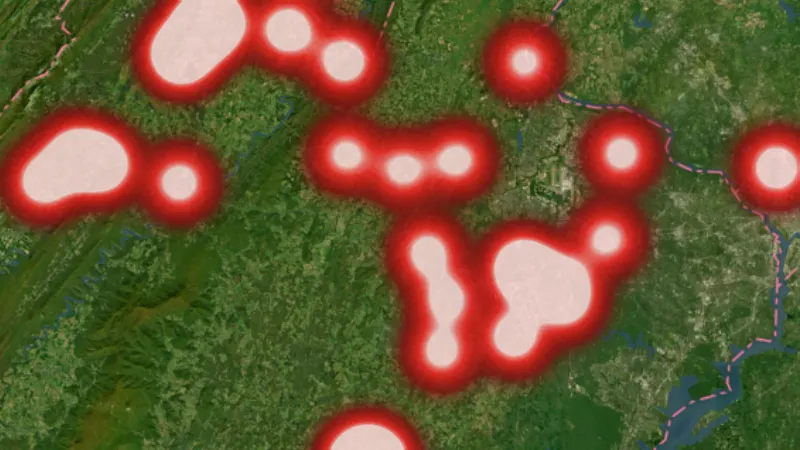
    Old Schools

    Old-school records help you research where education and community activity took place.

    Read the write-up
    Old Schools in USA coins and relics, drawn over satellite imagery© Mapbox, © Maxar

    The layer drawn over satellite imagery. Satellite imagery © Mapbox, © Maxar.

    Explorer. Opens with Explorer or Pro. On the Free plan it works inside your one free area of 250 km².

    Open in the app

    About this layer

    Old-school records help you research where education and community activity took place. The heat shading highlights concentrations of these recorded sites. Compare the individual records with old maps; stronger shading does not tell you how many objects remain.

    What it is for

    Read the legend and compare stronger and weaker concentrations with the individual records, where available.

    Limits

    A stronger colour can reflect more recording or surveying. It is not a count of finds still in the ground or an exact search location.

    Source

    Data © USGS, BLM, USFWS, USFS; styling © Detector Maps™

    Legend

    Historical Heatmaps
    Heat shows site concentrations when zoomed out; from zoom 11 the individual sites appear. Tap one for details.
    • Ghost Towns
    • Old Schools
    • River Crossings & Ferries
    • Homesteads & Plantations
    • Mills
    • Military (all)
    • Forts, Camps & Batteries
    • Civil War Battles
    • Revolutionary War Battles
    • War of 1812 Battles
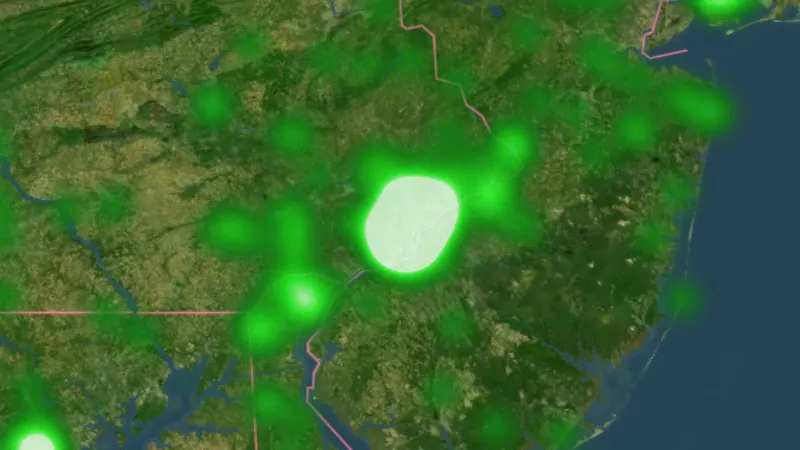
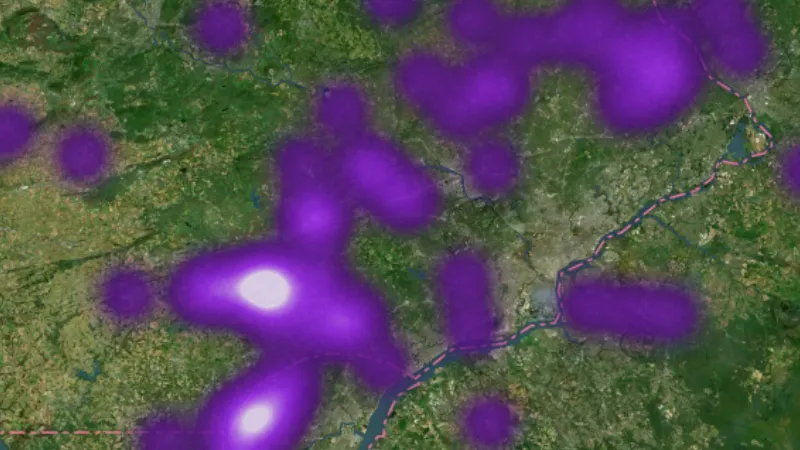
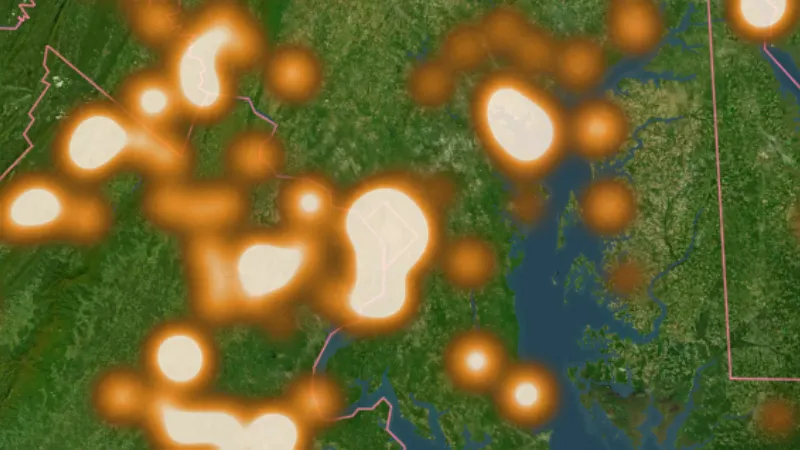
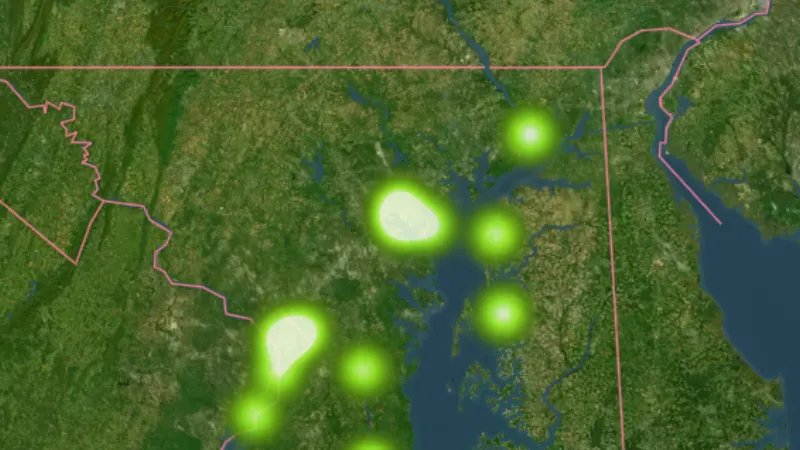
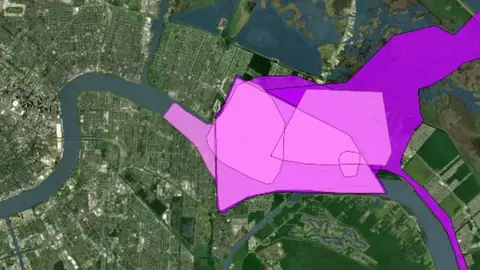
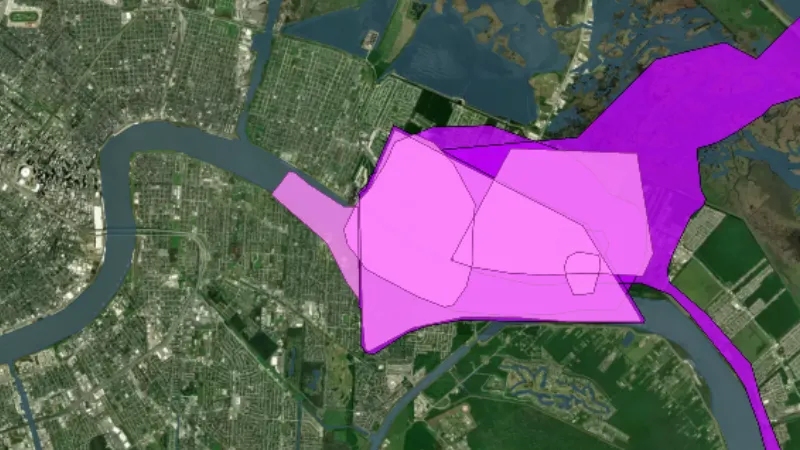
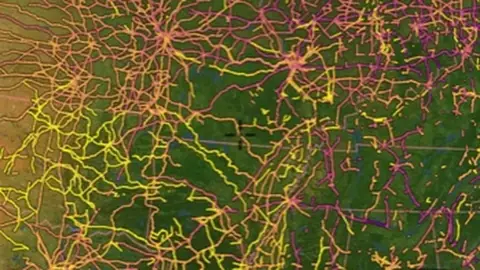
  • River Crossings & Ferries in USA coins and relics, drawn over satellite imagery© Mapbox, © Maxar
    Historical HeatmapsExplorer

    River Crossings & Ferries

    Crossing and ferry records show places associated with people moving across waterways.
    Read the write-up
    River Crossings & Ferries in USA coins and relics, drawn over satellite imagery© Mapbox, © Maxar

    The layer drawn over satellite imagery. Satellite imagery © Mapbox, © Maxar.

    Explorer. Opens with Explorer or Pro. On the Free plan it works inside your one free area of 250 km².

    Open in the app

    About this layer

    Crossing and ferry records show places associated with people moving across waterways. The heat shading highlights concentrations of these recorded sites. Compare the individual records with old maps; stronger shading does not tell you how many objects remain.
    What it is for

    Read the legend and compare stronger and weaker concentrations with the individual records, where available.

    Limits

    A stronger colour can reflect more recording or surveying. It is not a count of finds still in the ground or an exact search location.

    Source

    Data © USGS, BLM, USFWS, USFS; styling © Detector Maps™

    Legend

    Historical Heatmaps
    Heat shows site concentrations when zoomed out; from zoom 11 the individual sites appear. Tap one for details.
    • Ghost Towns
    • Old Schools
    • River Crossings & Ferries
    • Homesteads & Plantations
    • Mills
    • Military (all)
    • Forts, Camps & Batteries
    • Civil War Battles
    • Revolutionary War Battles
    • War of 1812 Battles
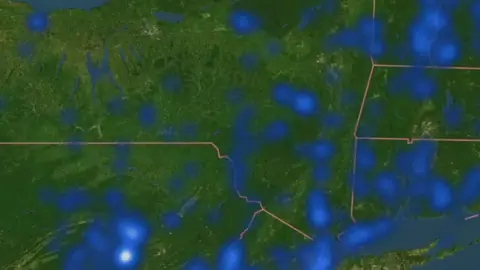
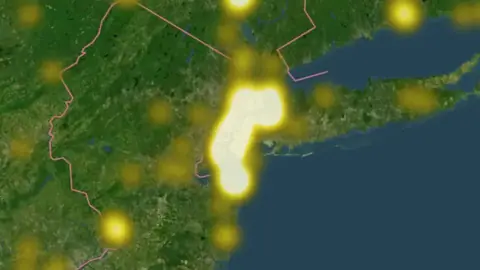
  • Homesteads & Plantations in USA coins and relics, drawn over satellite imagery© Mapbox, © Maxar
    Historical HeatmapsExplorer

    Homesteads & Plantations

    Homestead and plantation records identify places associated with earlier farms and settlement.

    Read the write-up
    Homesteads & Plantations in USA coins and relics, drawn over satellite imagery© Mapbox, © Maxar

    The layer drawn over satellite imagery. Satellite imagery © Mapbox, © Maxar.

    Explorer. Opens with Explorer or Pro. On the Free plan it works inside your one free area of 250 km².

    Open in the app

    About this layer

    Homestead and plantation records identify places associated with earlier farms and settlement. The heat shading highlights concentrations of these recorded sites. Compare the individual records with old maps; stronger shading does not tell you how many objects remain.

    What it is for

    Read the legend and compare stronger and weaker concentrations with the individual records, where available.

    Limits

    A stronger colour can reflect more recording or surveying. It is not a count of finds still in the ground or an exact search location.

    Source

    Data © USGS, BLM, USFWS, USFS; styling © Detector Maps™

    Legend

    Historical Heatmaps
    Heat shows site concentrations when zoomed out; from zoom 11 the individual sites appear. Tap one for details.
    • Ghost Towns
    • Old Schools
    • River Crossings & Ferries
    • Homesteads & Plantations
    • Mills
    • Military (all)
    • Forts, Camps & Batteries
    • Civil War Battles
    • Revolutionary War Battles
    • War of 1812 Battles
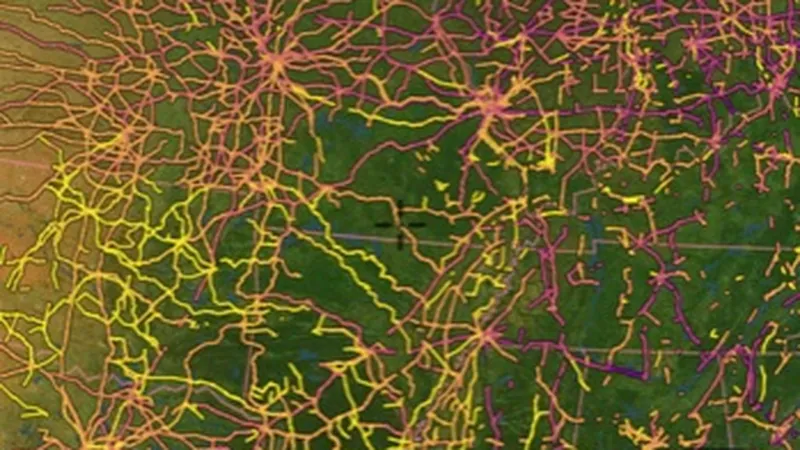
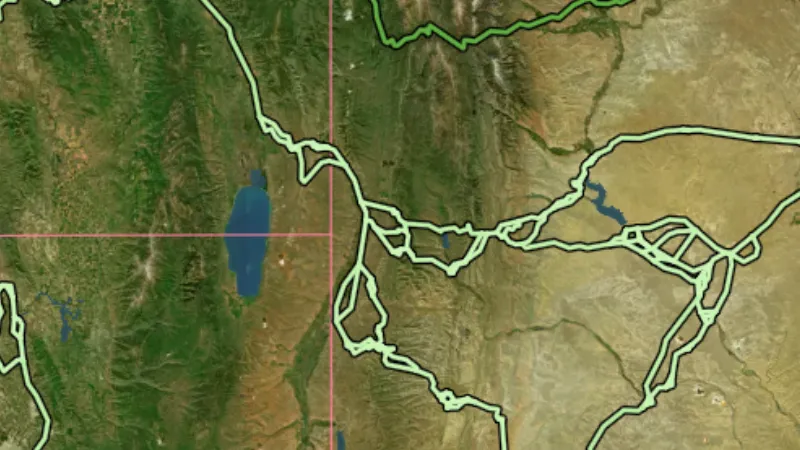
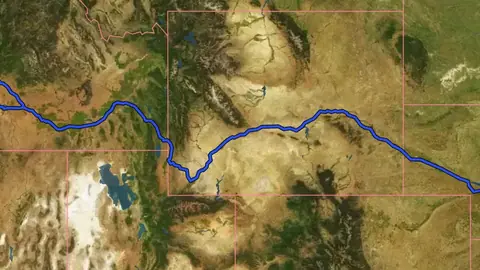
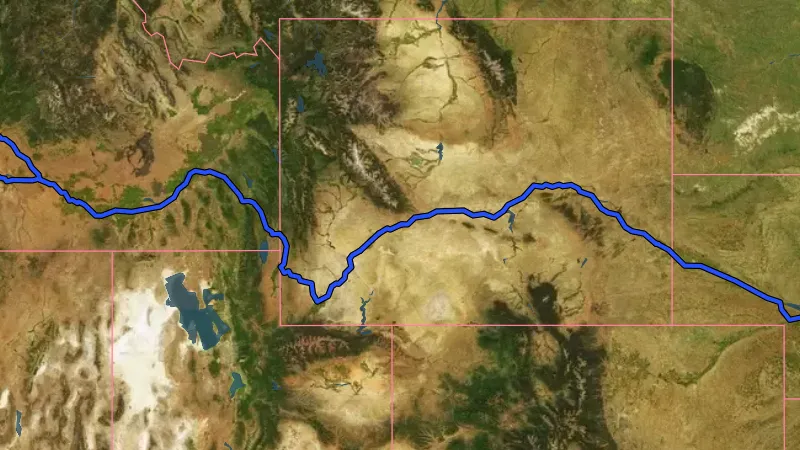
  • Mills in USA coins and relics, drawn over satellite imagery© Mapbox, © Maxar
    Historical HeatmapsExplorer

    Mills

    Mill records show places associated with processing grain, timber or other material.
    Read the write-up
    Mills in USA coins and relics, drawn over satellite imagery© Mapbox, © Maxar

    The layer drawn over satellite imagery. Satellite imagery © Mapbox, © Maxar.

    Explorer. Opens with Explorer or Pro. On the Free plan it works inside your one free area of 250 km².

    Open in the app

    About this layer

    Mill records show places associated with processing grain, timber or other material. The heat shading highlights concentrations of these recorded sites. Compare the individual records with old maps; stronger shading does not tell you how many objects remain.
    What it is for

    Read the legend and compare stronger and weaker concentrations with the individual records, where available.

    Limits

    A stronger colour can reflect more recording or surveying. It is not a count of finds still in the ground or an exact search location.
    Source

    Data © USGS, BLM, USFWS, USFS; styling © Detector Maps™

    Legend

    Historical Heatmaps
    Heat shows site concentrations when zoomed out; from zoom 11 the individual sites appear. Tap one for details.
    • Ghost Towns
    • Old Schools
    • River Crossings & Ferries
    • Homesteads & Plantations
    • Mills
    • Military (all)
    • Forts, Camps & Batteries
    • Civil War Battles
    • Revolutionary War Battles
    • War of 1812 Battles
  • Military (all) in USA coins and relics, drawn over satellite imagery© Mapbox, © Maxar
    Historical HeatmapsExplorer

    Military (all)

    These records identify places associated with forts, camps, batteries or other historic military activity.

    Read the write-up
    Military (all) in USA coins and relics, drawn over satellite imagery© Mapbox, © Maxar

    The layer drawn over satellite imagery. Satellite imagery © Mapbox, © Maxar.

    Explorer. Opens with Explorer or Pro. On the Free plan it works inside your one free area of 250 km².

    Open in the app

    About this layer

    These records identify places associated with forts, camps, batteries or other historic military activity. The heat shading highlights concentrations of these recorded sites. Compare the individual records with old maps; stronger shading does not tell you how many objects remain.

    What it is for

    Read the legend and compare stronger and weaker concentrations with the individual records, where available.

    Limits

    A stronger colour can reflect more recording or surveying. It is not a count of finds still in the ground or an exact search location.

    Source

    Data © USGS, BLM, USFWS, USFS; styling © Detector Maps™

    Legend

    Historical Heatmaps
    Heat shows site concentrations when zoomed out; from zoom 11 the individual sites appear. Tap one for details.
    • Ghost Towns
    • Old Schools
    • River Crossings & Ferries
    • Homesteads & Plantations
    • Mills
    • Military (all)
    • Forts, Camps & Batteries
    • Civil War Battles
    • Revolutionary War Battles
    • War of 1812 Battles
  • Forts, Camps & Batteries in USA coins and relics, drawn over satellite imagery© Mapbox, © Maxar
    Historical HeatmapsExplorer

    Forts, Camps & Batteries

    These records identify places associated with forts, camps, batteries or other historic military activity.

    Read the write-up
    Forts, Camps & Batteries in USA coins and relics, drawn over satellite imagery© Mapbox, © Maxar

    The layer drawn over satellite imagery. Satellite imagery © Mapbox, © Maxar.

    Explorer. Opens with Explorer or Pro. On the Free plan it works inside your one free area of 250 km².

    Open in the app

    About this layer

    These records identify places associated with forts, camps, batteries or other historic military activity. The heat shading highlights concentrations of these recorded sites. Compare the individual records with old maps; stronger shading does not tell you how many objects remain.

    What it is for

    Read the legend and compare stronger and weaker concentrations with the individual records, where available.

    Limits

    A stronger colour can reflect more recording or surveying. It is not a count of finds still in the ground or an exact search location.

    Source

    Data © USGS, BLM, USFWS, USFS; styling © Detector Maps™

    Legend

    Historical Heatmaps
    Heat shows site concentrations when zoomed out; from zoom 11 the individual sites appear. Tap one for details.
    • Ghost Towns
    • Old Schools
    • River Crossings & Ferries
    • Homesteads & Plantations
    • Mills
    • Military (all)
    • Forts, Camps & Batteries
    • Civil War Battles
    • Revolutionary War Battles
    • War of 1812 Battles
  • Civil War Battles in USA coins and relics, drawn over satellite imagery© Mapbox, © Maxar
    Historical HeatmapsExplorer

    Civil War Battles

    Battle records identify reported locations associated with the selected conflict.

    Read the write-up
    Civil War Battles in USA coins and relics, drawn over satellite imagery© Mapbox, © Maxar

    The layer drawn over satellite imagery. Satellite imagery © Mapbox, © Maxar.

    Explorer. Opens with Explorer or Pro. On the Free plan it works inside your one free area of 250 km².

    Open in the app

    About this layer

    Battle records identify reported locations associated with the selected conflict. The heat shading highlights concentrations of these recorded sites. Compare the individual records with old maps; stronger shading does not tell you how many objects remain.

    What it is for

    Read the legend and compare stronger and weaker concentrations with the individual records, where available.

    Limits

    A stronger colour can reflect more recording or surveying. It is not a count of finds still in the ground or an exact search location.

    Source

    Data © USGS, BLM, USFWS, USFS; styling © Detector Maps™

    Legend

    Historical Heatmaps
    Heat shows site concentrations when zoomed out; from zoom 11 the individual sites appear. Tap one for details.
    • Ghost Towns
    • Old Schools
    • River Crossings & Ferries
    • Homesteads & Plantations
    • Mills
    • Military (all)
    • Forts, Camps & Batteries
    • Civil War Battles
    • Revolutionary War Battles
    • War of 1812 Battles
  • Revolutionary War Battles in USA coins and relics, drawn over satellite imagery© Mapbox, © Maxar
    Historical HeatmapsExplorer

    Revolutionary War Battles

    Battle records identify reported locations associated with the selected conflict.

    Read the write-up
    Revolutionary War Battles in USA coins and relics, drawn over satellite imagery© Mapbox, © Maxar

    The layer drawn over satellite imagery. Satellite imagery © Mapbox, © Maxar.

    Explorer. Opens with Explorer or Pro. On the Free plan it works inside your one free area of 250 km².

    Open in the app

    About this layer

    Battle records identify reported locations associated with the selected conflict. The heat shading highlights concentrations of these recorded sites. Compare the individual records with old maps; stronger shading does not tell you how many objects remain.

    What it is for

    Read the legend and compare stronger and weaker concentrations with the individual records, where available.

    Limits

    A stronger colour can reflect more recording or surveying. It is not a count of finds still in the ground or an exact search location.

    Source

    Data © USGS, BLM, USFWS, USFS; styling © Detector Maps™

    Legend

    Historical Heatmaps
    Heat shows site concentrations when zoomed out; from zoom 11 the individual sites appear. Tap one for details.
    • Ghost Towns
    • Old Schools
    • River Crossings & Ferries
    • Homesteads & Plantations
    • Mills
    • Military (all)
    • Forts, Camps & Batteries
    • Civil War Battles
    • Revolutionary War Battles
    • War of 1812 Battles
  • War of 1812 Battles in USA coins and relics, drawn over satellite imagery© Mapbox, © Maxar
    Historical HeatmapsExplorer

    War of 1812 Battles

    Battle records identify reported locations associated with the selected conflict.

    Read the write-up
    War of 1812 Battles in USA coins and relics, drawn over satellite imagery© Mapbox, © Maxar

    The layer drawn over satellite imagery. Satellite imagery © Mapbox, © Maxar.

    Explorer. Opens with Explorer or Pro. On the Free plan it works inside your one free area of 250 km².

    Open in the app

    About this layer

    Battle records identify reported locations associated with the selected conflict. The heat shading highlights concentrations of these recorded sites. Compare the individual records with old maps; stronger shading does not tell you how many objects remain.

    What it is for

    Read the legend and compare stronger and weaker concentrations with the individual records, where available.

    Limits

    A stronger colour can reflect more recording or surveying. It is not a count of finds still in the ground or an exact search location.

    Source

    Data © USGS, BLM, USFWS, USFS; styling © Detector Maps™

    Legend

    Historical Heatmaps
    Heat shows site concentrations when zoomed out; from zoom 11 the individual sites appear. Tap one for details.
    • Ghost Towns
    • Old Schools
    • River Crossings & Ferries
    • Homesteads & Plantations
    • Mills
    • Military (all)
    • Forts, Camps & Batteries
    • Civil War Battles
    • Revolutionary War Battles
    • War of 1812 Battles

Battlefield Areas

3
  • Civil War in the Detector Maps app, USA coins and relics© Mapbox, © Maxar
    Battlefield AreasExplorer

    Civil War

    Battlefield areas map the extent of recorded studies or core fighting areas.

    Read the write-up
    Civil War in the Detector Maps app, USA coins and relics© Mapbox, © Maxar

    A screen from the Detector Maps app. Satellite imagery © Mapbox, © Maxar.

    Explorer. Opens with Explorer or Pro. On the Free plan it works inside your one free area of 250 km².

    Open in the app

    About this layer

    Battlefield areas map the extent of recorded studies or core fighting areas. Use them to understand the wider historic landscape and check protections. A study boundary is not a detecting permission boundary.

    What it is for

    Read the available record and compare its date, description and location with other historical sources.

    Limits

    Record locations may be generalised or approximate. Historic interest does not establish permission to detect or disturb a site.

    Source

    Data © USGS, BLM, USFWS, USFS; styling © Detector Maps™

    Disclaimer: Shown for historical reference only. Detecting or removing artifacts on protected battlefields (NPS, federal, tribal, or state land) is illegal under federal and state law, and private land needs the owner’s permission. Check the specific site’s rules before detecting.

    Legend

    Battlefield Areas
    • Civil War
    • Revolutionary War
    • War of 1812
  • Revolutionary War in USA coins and relics, drawn over satellite imagery© Mapbox, © Maxar
    Battlefield AreasExplorer

    Revolutionary War

    Battlefield areas map the extent of recorded studies or core fighting areas.

    Read the write-up
    Revolutionary War in USA coins and relics, drawn over satellite imagery© Mapbox, © Maxar

    The layer drawn over satellite imagery. Satellite imagery © Mapbox, © Maxar.

    Explorer. Opens with Explorer or Pro. On the Free plan it works inside your one free area of 250 km².

    Open in the app

    About this layer

    Battlefield areas map the extent of recorded studies or core fighting areas. Use them to understand the wider historic landscape and check protections. A study boundary is not a detecting permission boundary.

    What it is for

    Read the available record and compare its date, description and location with other historical sources.

    Limits

    Record locations may be generalised or approximate. Historic interest does not establish permission to detect or disturb a site.

    Source

    Data © USGS, BLM, USFWS, USFS; styling © Detector Maps™

    Disclaimer: Shown for historical reference only. Detecting or removing artifacts on protected battlefields (NPS, federal, tribal, or state land) is illegal under federal and state law, and private land needs the owner’s permission. Check the specific site’s rules before detecting.

    Legend

    Battlefield Areas
    • Civil War
    • Revolutionary War
    • War of 1812
  • War of 1812 in USA coins and relics, drawn over satellite imagery© Mapbox, © Maxar
    Battlefield AreasExplorer

    War of 1812

    Battlefield areas map the extent of recorded studies or core fighting areas.

    Read the write-up
    War of 1812 in USA coins and relics, drawn over satellite imagery© Mapbox, © Maxar

    The layer drawn over satellite imagery. Satellite imagery © Mapbox, © Maxar.

    Explorer. Opens with Explorer or Pro. On the Free plan it works inside your one free area of 250 km².

    Open in the app

    About this layer

    Battlefield areas map the extent of recorded studies or core fighting areas. Use them to understand the wider historic landscape and check protections. A study boundary is not a detecting permission boundary.

    What it is for

    Read the available record and compare its date, description and location with other historical sources.

    Limits

    Record locations may be generalised or approximate. Historic interest does not establish permission to detect or disturb a site.

    Source

    Data © USGS, BLM, USFWS, USFS; styling © Detector Maps™

    Disclaimer: Shown for historical reference only. Detecting or removing artifacts on protected battlefields (NPS, federal, tribal, or state land) is illegal under federal and state law, and private land needs the owner’s permission. Check the specific site’s rules before detecting.

    Legend

    Battlefield Areas
    • Civil War
    • Revolutionary War
    • War of 1812

National Historic Trails

10
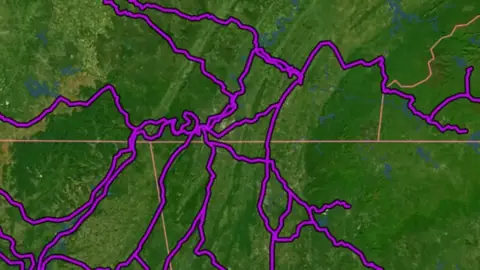
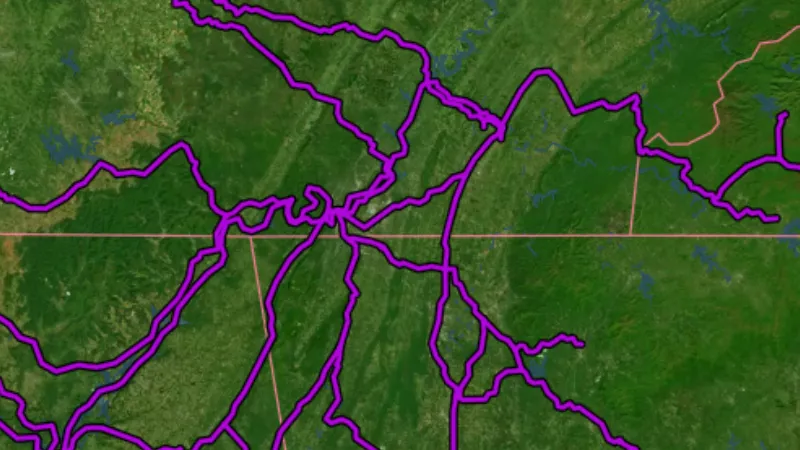
  • Historic Railroads in the Detector Maps app, USA coins and relics© Mapbox, © Maxar
    National Historic TrailsExplorer

    Historic Railroads

    Historic railroad lines (with date built / gauge attributes). Tap a line for details.

    Read the write-up
    Historic Railroads in the Detector Maps app, USA coins and relics© Mapbox, © Maxar

    A screen from the Detector Maps app. Satellite imagery © Mapbox, © Maxar.

    Explorer. Opens with Explorer or Pro. On the Free plan it works inside your one free area of 250 km².

    Open in the app

    About this layer

    Historic railroad records show earlier rail routes. They can help you connect old settlements, industry and transport sites on historical maps. A former railway is not necessarily abandoned, accessible or safe to walk.

    What it is for

    Compare the old route with modern roads, settlements and terrain to research how people moved through the area.

    Limits

    The route may be approximate, changed or no longer visible. It does not establish a present-day right of access.

    Source

    Data © USGS, BLM, USFWS, USFS; styling © Detector Maps™

    Legend

    Historic Railroads
    Line colour shows the year the railroad was in operation by.
    • 1830
    • 1845
    • 1859
    • 1873
    • 1888
    • 1902
    • 1916
  • California in USA coins and relics, drawn over satellite imagery© Mapbox, © Maxar
    National Historic TrailsExplorer

    California

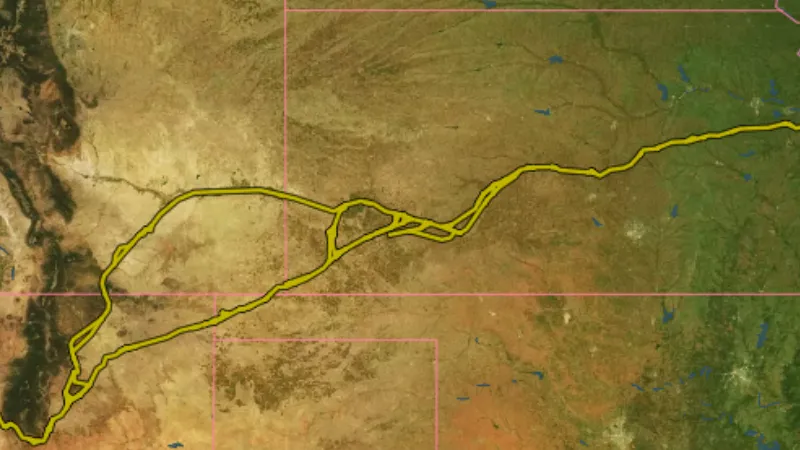
    Historic trails show mapped routes associated with earlier travel and migration.

    Read the write-up
    California in USA coins and relics, drawn over satellite imagery© Mapbox, © Maxar

    The layer drawn over satellite imagery. Satellite imagery © Mapbox, © Maxar.

    Explorer. Opens with Explorer or Pro. On the Free plan it works inside your one free area of 250 km².

    Open in the app

    About this layer

    Historic trails show mapped routes associated with earlier travel and migration. Compare them with terrain, settlements and old maps to research a route. The historic alignment may cross private or protected land and may not be a current walking trail.

    What it is for

    Compare the old route with modern roads, settlements and terrain to research how people moved through the area.

    Limits

    The route may be approximate, changed or no longer visible. It does not establish a present-day right of access.

    Source

    Data © USGS, BLM, USFWS, USFS; styling © Detector Maps™

    Legend

    National Historic Trails
    • California
    • Oregon
    • Mormon Pioneer
    • Santa Fe
    • Old Spanish
    • Nez Perce
    • Butterfield Overland
    • Trail of Tears
    • Lewis & Clark
  • Oregon in USA coins and relics, drawn over satellite imagery© Mapbox, © Maxar
    National Historic TrailsExplorer

    Oregon

    Historic trails show mapped routes associated with earlier travel and migration.

    Read the write-up
    Oregon in USA coins and relics, drawn over satellite imagery© Mapbox, © Maxar

    The layer drawn over satellite imagery. Satellite imagery © Mapbox, © Maxar.

    Explorer. Opens with Explorer or Pro. On the Free plan it works inside your one free area of 250 km².

    Open in the app

    About this layer

    Historic trails show mapped routes associated with earlier travel and migration. Compare them with terrain, settlements and old maps to research a route. The historic alignment may cross private or protected land and may not be a current walking trail.

    What it is for

    Compare the old route with modern roads, settlements and terrain to research how people moved through the area.

    Limits

    The route may be approximate, changed or no longer visible. It does not establish a present-day right of access.

    Source

    Data © USGS, BLM, USFWS, USFS; styling © Detector Maps™

    Legend

    National Historic Trails
    • California
    • Oregon
    • Mormon Pioneer
    • Santa Fe
    • Old Spanish
    • Nez Perce
    • Butterfield Overland
    • Trail of Tears
    • Lewis & Clark
  • Mormon Pioneer in USA coins and relics, drawn over satellite imagery© Mapbox, © Maxar
    National Historic TrailsExplorer

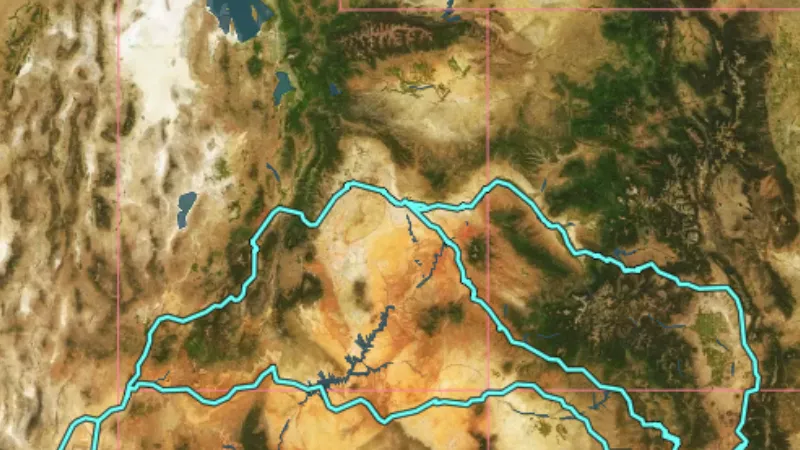
    Mormon Pioneer

    Historic trails show mapped routes associated with earlier travel and migration.

    Read the write-up
    Mormon Pioneer in USA coins and relics, drawn over satellite imagery© Mapbox, © Maxar

    The layer drawn over satellite imagery. Satellite imagery © Mapbox, © Maxar.

    Explorer. Opens with Explorer or Pro. On the Free plan it works inside your one free area of 250 km².

    Open in the app

    About this layer

    Historic trails show mapped routes associated with earlier travel and migration. Compare them with terrain, settlements and old maps to research a route. The historic alignment may cross private or protected land and may not be a current walking trail.

    What it is for

    Compare the old route with modern roads, settlements and terrain to research how people moved through the area.

    Limits

    The route may be approximate, changed or no longer visible. It does not establish a present-day right of access.

    Source

    Data © USGS, BLM, USFWS, USFS; styling © Detector Maps™

    Legend

    National Historic Trails
    • California
    • Oregon
    • Mormon Pioneer
    • Santa Fe
    • Old Spanish
    • Nez Perce
    • Butterfield Overland
    • Trail of Tears
    • Lewis & Clark
  • Santa Fe in USA coins and relics, drawn over satellite imagery© Mapbox, © Maxar
    National Historic TrailsExplorer

    Santa Fe

    Historic trails show mapped routes associated with earlier travel and migration.

    Read the write-up
    Santa Fe in USA coins and relics, drawn over satellite imagery© Mapbox, © Maxar

    The layer drawn over satellite imagery. Satellite imagery © Mapbox, © Maxar.

    Explorer. Opens with Explorer or Pro. On the Free plan it works inside your one free area of 250 km².

    Open in the app

    About this layer

    Historic trails show mapped routes associated with earlier travel and migration. Compare them with terrain, settlements and old maps to research a route. The historic alignment may cross private or protected land and may not be a current walking trail.

    What it is for

    Compare the old route with modern roads, settlements and terrain to research how people moved through the area.

    Limits

    The route may be approximate, changed or no longer visible. It does not establish a present-day right of access.

    Source

    Data © USGS, BLM, USFWS, USFS; styling © Detector Maps™

    Legend

    National Historic Trails
    • California
    • Oregon
    • Mormon Pioneer
    • Santa Fe
    • Old Spanish
    • Nez Perce
    • Butterfield Overland
    • Trail of Tears
    • Lewis & Clark
  • Old Spanish in USA coins and relics, drawn over satellite imagery© Mapbox, © Maxar
    National Historic TrailsExplorer

    Old Spanish

    Historic trails show mapped routes associated with earlier travel and migration.

    Read the write-up
    Old Spanish in USA coins and relics, drawn over satellite imagery© Mapbox, © Maxar

    The layer drawn over satellite imagery. Satellite imagery © Mapbox, © Maxar.

    Explorer. Opens with Explorer or Pro. On the Free plan it works inside your one free area of 250 km².

    Open in the app

    About this layer

    Historic trails show mapped routes associated with earlier travel and migration. Compare them with terrain, settlements and old maps to research a route. The historic alignment may cross private or protected land and may not be a current walking trail.

    What it is for

    Compare the old route with modern roads, settlements and terrain to research how people moved through the area.

    Limits

    The route may be approximate, changed or no longer visible. It does not establish a present-day right of access.

    Source

    Data © USGS, BLM, USFWS, USFS; styling © Detector Maps™

    Legend

    National Historic Trails
    • California
    • Oregon
    • Mormon Pioneer
    • Santa Fe
    • Old Spanish
    • Nez Perce
    • Butterfield Overland
    • Trail of Tears
    • Lewis & Clark
  • Nez Perce (Nee-Me-Poo) in USA coins and relics, drawn over satellite imagery© Mapbox, © Maxar
    National Historic TrailsExplorer

    Nez Perce (Nee-Me-Poo)

    Historic trails show mapped routes associated with earlier travel and migration.

    Read the write-up
    Nez Perce (Nee-Me-Poo) in USA coins and relics, drawn over satellite imagery© Mapbox, © Maxar

    The layer drawn over satellite imagery. Satellite imagery © Mapbox, © Maxar.

    Explorer. Opens with Explorer or Pro. On the Free plan it works inside your one free area of 250 km².

    Open in the app

    About this layer

    Historic trails show mapped routes associated with earlier travel and migration. Compare them with terrain, settlements and old maps to research a route. The historic alignment may cross private or protected land and may not be a current walking trail.

    What it is for

    Compare the old route with modern roads, settlements and terrain to research how people moved through the area.

    Limits

    The route may be approximate, changed or no longer visible. It does not establish a present-day right of access.

    Source

    Data © USGS, BLM, USFWS, USFS; styling © Detector Maps™

    Legend

    National Historic Trails
    • California
    • Oregon
    • Mormon Pioneer
    • Santa Fe
    • Old Spanish
    • Nez Perce
    • Butterfield Overland
    • Trail of Tears
    • Lewis & Clark
  • Butterfield Overland in USA coins and relics, drawn over satellite imagery© Mapbox, © Maxar
    National Historic TrailsExplorer

    Butterfield Overland

    Historic trails show mapped routes associated with earlier travel and migration.

    Read the write-up
    Butterfield Overland in USA coins and relics, drawn over satellite imagery© Mapbox, © Maxar

    The layer drawn over satellite imagery. Satellite imagery © Mapbox, © Maxar.

    Explorer. Opens with Explorer or Pro. On the Free plan it works inside your one free area of 250 km².

    Open in the app

    About this layer

    Historic trails show mapped routes associated with earlier travel and migration. Compare them with terrain, settlements and old maps to research a route. The historic alignment may cross private or protected land and may not be a current walking trail.

    What it is for

    Compare the old route with modern roads, settlements and terrain to research how people moved through the area.

    Limits

    The route may be approximate, changed or no longer visible. It does not establish a present-day right of access.

    Source

    Data © USGS, BLM, USFWS, USFS; styling © Detector Maps™

    Legend

    National Historic Trails
    • California
    • Oregon
    • Mormon Pioneer
    • Santa Fe
    • Old Spanish
    • Nez Perce
    • Butterfield Overland
    • Trail of Tears
    • Lewis & Clark
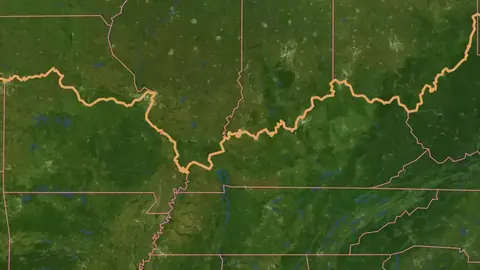
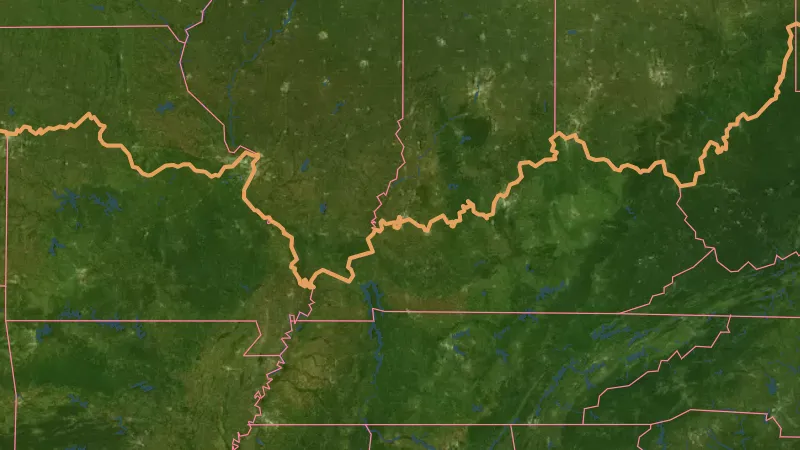
  • Trail of Tears in USA coins and relics, drawn over satellite imagery© Mapbox, © Maxar
    National Historic TrailsExplorer

    Trail of Tears

    Historic trails show mapped routes associated with earlier travel and migration.

    Read the write-up
    Trail of Tears in USA coins and relics, drawn over satellite imagery© Mapbox, © Maxar

    The layer drawn over satellite imagery. Satellite imagery © Mapbox, © Maxar.

    Explorer. Opens with Explorer or Pro. On the Free plan it works inside your one free area of 250 km².

    Open in the app

    About this layer

    Historic trails show mapped routes associated with earlier travel and migration. Compare them with terrain, settlements and old maps to research a route. The historic alignment may cross private or protected land and may not be a current walking trail.

    What it is for

    Compare the old route with modern roads, settlements and terrain to research how people moved through the area.

    Limits

    The route may be approximate, changed or no longer visible. It does not establish a present-day right of access.

    Source

    Data © USGS, BLM, USFWS, USFS; styling © Detector Maps™

    Legend

    National Historic Trails
    • California
    • Oregon
    • Mormon Pioneer
    • Santa Fe
    • Old Spanish
    • Nez Perce
    • Butterfield Overland
    • Trail of Tears
    • Lewis & Clark
  • Lewis & Clark in USA coins and relics, drawn over satellite imagery© Mapbox, © Maxar
    National Historic TrailsExplorer

    Lewis & Clark

    Historic trails show mapped routes associated with earlier travel and migration.

    Read the write-up
    Lewis & Clark in USA coins and relics, drawn over satellite imagery© Mapbox, © Maxar

    The layer drawn over satellite imagery. Satellite imagery © Mapbox, © Maxar.

    Explorer. Opens with Explorer or Pro. On the Free plan it works inside your one free area of 250 km².

    Open in the app

    About this layer

    Historic trails show mapped routes associated with earlier travel and migration. Compare them with terrain, settlements and old maps to research a route. The historic alignment may cross private or protected land and may not be a current walking trail.

    What it is for

    Compare the old route with modern roads, settlements and terrain to research how people moved through the area.

    Limits

    The route may be approximate, changed or no longer visible. It does not establish a present-day right of access.

    Source

    Data © USGS, BLM, USFWS, USFS; styling © Detector Maps™

    Legend

    National Historic Trails
    • California
    • Oregon
    • Mormon Pioneer
    • Santa Fe
    • Old Spanish
    • Nez Perce
    • Butterfield Overland
    • Trail of Tears
    • Lewis & Clark

Roads & Tracks

2
  • BLM Roads & Trails in the Detector Maps app, USA coins and relics© Mapbox, © Maxar
    Roads & TracksExplorer

    BLM Roads & Trails

    BLM road and trail network: ground transport routes, public motorised roads, limited-use roads, and national scenic trails.

    Read the write-up
    BLM Roads & Trails in the Detector Maps app, USA coins and relics© Mapbox, © Maxar

    A screen from the Detector Maps app. Satellite imagery © Mapbox, © Maxar.

    Explorer. Opens with Explorer or Pro. On the Free plan it works inside your one free area of 250 km².

    Open in the app

    About this layer

    Roads and tracks show mapped routes through the area. Compare them with land boundaries and terrain when planning how to reach a location. A mapped route may be closed, private or unsuitable for your vehicle.

    What it is for

    Compare routes with the terrain and land boundaries when planning how to reach an area.

    Limits

    A line on the map does not guarantee a public, open or passable route. Conditions and access can change.

    Source

    Data © USGS, BLM, USFWS, USFS; styling © Detector Maps™

    Legend

    Roads & Trails
    • MVUM Roads
    • 4WD High Clearance
    • ATV Open
    • Motorcycle Open
    • Other Roads
    • BLM Roads
    • Scenic / Historic Trail
    • Public Motorized
    • Limited Public Motor
    • Ground Transport
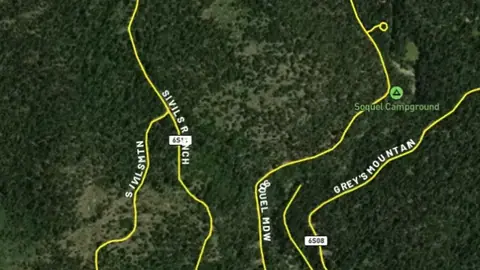
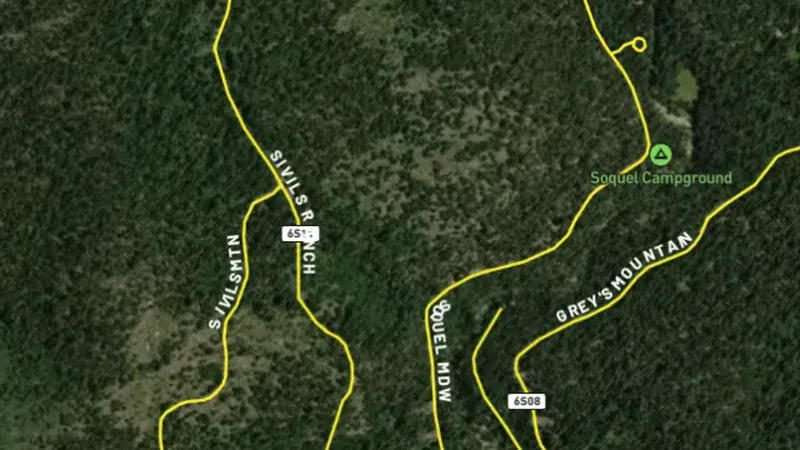
  • MVUM Roads in the Detector Maps app, USA coins and relics© Mapbox, © Maxar
    Roads & TracksExplorer

    MVUM Roads

    Motor Vehicle Use Map (MVUM) roads from the U.S. Forest Service designated for motorised vehicle use.

    Read the write-up
    MVUM Roads in the Detector Maps app, USA coins and relics© Mapbox, © Maxar

    A screen from the Detector Maps app. Satellite imagery © Mapbox, © Maxar.

    Explorer. Opens with Explorer or Pro. On the Free plan it works inside your one free area of 250 km².

    Open in the app

    About this layer

    Motor Vehicle Use Maps show designated vehicle routes on the mapped Forest Service land. Read the route details for the vehicle type and season where available. Check current closures and conditions before travelling.

    What it is for

    Compare routes with the terrain and land boundaries when planning how to reach an area.

    Limits

    A line on the map does not guarantee a public, open or passable route. Conditions and access can change.

    Source

    Data © USGS, BLM, USFWS, USFS; styling © Detector Maps™

    Legend

    Roads & Trails
    • MVUM Roads
    • 4WD High Clearance
    • ATV Open
    • Motorcycle Open
    • Other Roads
    • BLM Roads
    • Scenic / Historic Trail
    • Public Motorized
    • Limited Public Motor
    • Ground Transport

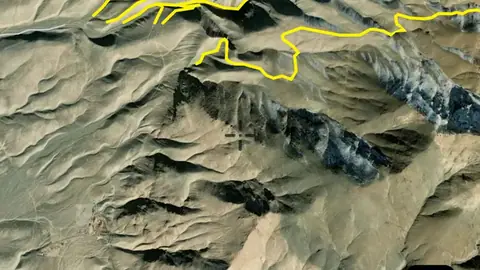
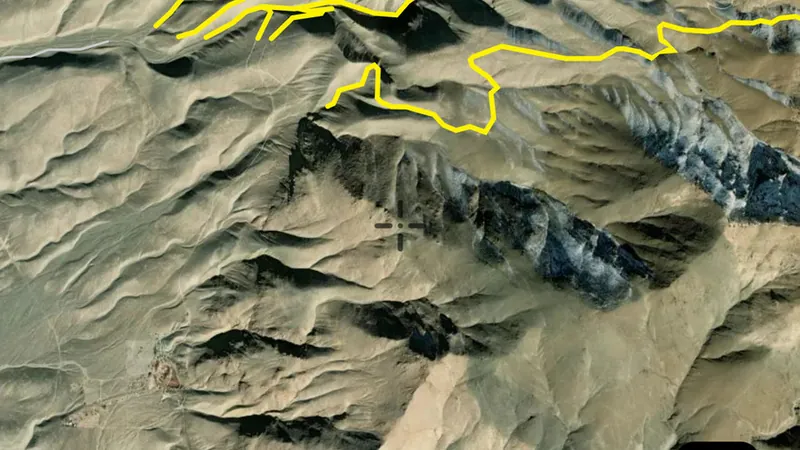
    Draws from zoom 14.

Watercourses

1
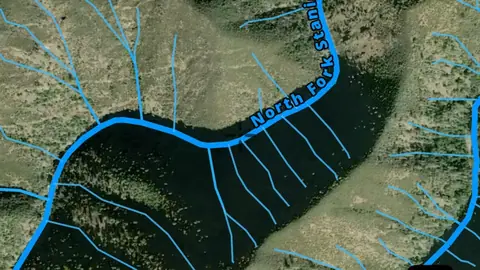
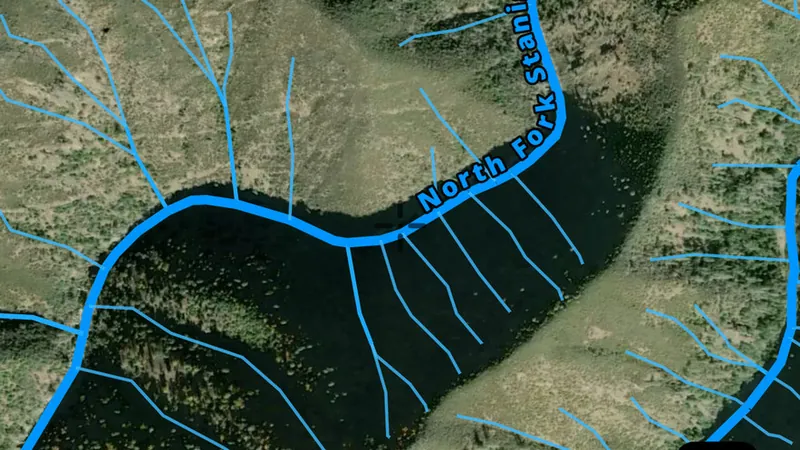
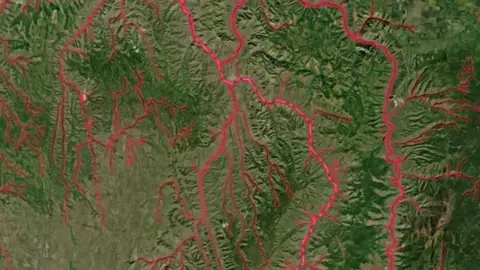
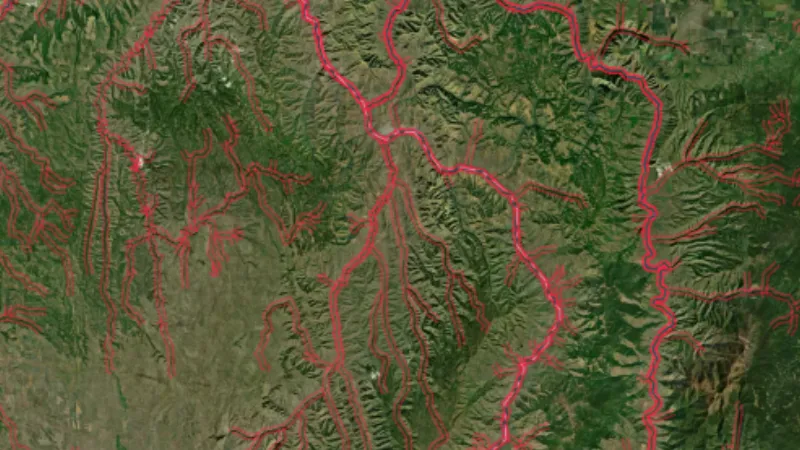
  • Rivers, Streams & Drainages in the Detector Maps app, USA coins and relics© Mapbox, © Maxar
    WatercoursesExplorer

    Rivers, Streams & Drainages

    Waterways show the mapped routes of rivers, creeks and drainage lines.

    Read the write-up
    Rivers, Streams & Drainages in the Detector Maps app, USA coins and relics© Mapbox, © Maxar

    A screen from the Detector Maps app. Satellite imagery © Mapbox, © Maxar.

    Explorer. Opens with Explorer or Pro. On the Free plan it works inside your one free area of 250 km².

    Open in the app

    About this layer

    Waterways show the mapped routes of rivers, creeks and drainage lines. Follow their connections and compare them with terrain when researching how sediment moves. A mapped waterway may be dry or altered, and does not establish access.

    What it is for

    Follow drainage connections and compare them with terrain. Read the selected layer name and legend to distinguish feature types.

    Limits

    A mapped waterway may be dry, altered or difficult to cross. It does not establish access or permission to work in the waterway.

    Source

    Data © USGS, BLM, USFWS, USFS; styling © Detector Maps™

    Legend

    Watercourses
    • Streams (by order)
    • Major River (6+)
    • Medium Stream (4-5)
    • Small Stream (2-3)
    • Creek (1)
    • Water Bodies
    • Lake / Reservoir

Land Use & Access

5
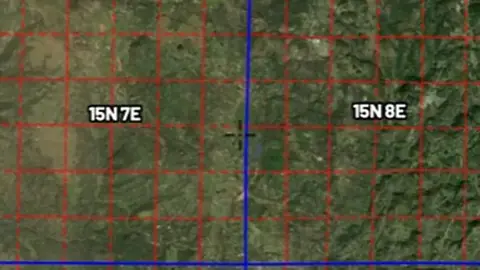
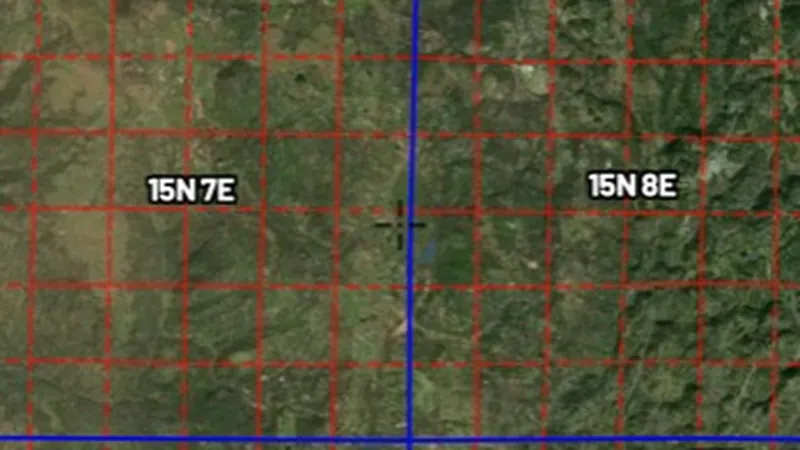
  • PLSS Survey Grid in the Detector Maps app, USA coins and relics© Mapbox, © Maxar
    Land Use & AccessExplorer

    PLSS Survey Grid

    Public Land Survey System (PLSS) grid showing townships, sections, and intersected areas.

    Read the write-up
    PLSS Survey Grid in the Detector Maps app, USA coins and relics© Mapbox, © Maxar

    A screen from the Detector Maps app. Satellite imagery © Mapbox, © Maxar.

    Explorer. Opens with Explorer or Pro. On the Free plan it works inside your one free area of 250 km².

    Open in the app

    About this layer

    The Public Land Survey System divides land into townships, sections and smaller surveyed units. Use the grid to locate land descriptions and relate them to records. Grid lines are reference boundaries, not mining claim boundaries or public access routes.

    What it is for

    Turn on the relevant layers together and read their legends and notes. Check current conditions with the land manager before planning a visit.

    Limits

    An unshaded area is not automatically available for detecting. Different permissions and restrictions can overlap.

    Source

    Data © USGS, BLM, USFWS, USFS; styling © Detector Maps™

    Legend

    Land Use & Access
    • Property Boundaries
    • PLSS Survey Grid
    • Surface Mgmt Agencies
    • BLM Recreation Sites
    • BLM Admin Units
  • Surface Management Agency Areas in the Detector Maps app, USA coins and relics© Mapbox, © Maxar
    Land Use & AccessExplorer

    Surface Management Agency Areas

    BLM Surface Management Agency boundaries showing which federal, state, or local agency manages each parcel.

    Read the write-up
    Surface Management Agency Areas in the Detector Maps app, USA coins and relics© Mapbox, © Maxar

    A screen from the Detector Maps app. Satellite imagery © Mapbox, © Maxar.

    Explorer. Opens with Explorer or Pro. On the Free plan it works inside your one free area of 250 km².

    Open in the app

    About this layer

    Surface management areas show the agency or organisation recorded as managing the land surface. Start here to identify whose guidance to check. Surface management can differ from mineral ownership and does not settle access by itself.

    What it is for

    Turn on the relevant layers together and read their legends and notes. Check current conditions with the land manager before planning a visit.

    Limits

    An unshaded area is not automatically available for detecting. Different permissions and restrictions can overlap.

    Source

    Data © USGS, BLM, USFWS, USFS; styling © Detector Maps™

    Legend

    Surface Management Agencies
    • BLM
    • USFS
    • NPS
    • FWS
    • BOR
    • MILITARY
    • TRIBAL
    • STATE TRUST
    • STATE PARK
    • LOCAL GOVT

    Filters in the app

    Category filter
  • BLM Recreation Sites in the Detector Maps app, USA coins and relics© Mapbox, © Maxar
    Land Use & AccessExplorer

    BLM Recreation Sites

    Bureau of Land Management recreation sites including campgrounds, trailheads, and day-use areas.

    Read the write-up
    BLM Recreation Sites in the Detector Maps app, USA coins and relics© Mapbox, © Maxar

    A screen from the Detector Maps app. Satellite imagery © Mapbox, © Maxar.

    Explorer. Opens with Explorer or Pro. On the Free plan it works inside your one free area of 250 km².

    Open in the app

    About this layer

    These records identify mapped recreation sites. They help you research facilities and managed places near your route. Check the site rules; a recreation site is not necessarily a permitted detecting area.

    What it is for

    Turn on the relevant layers together and read their legends and notes. Check current conditions with the land manager before planning a visit.

    Limits

    An unshaded area is not automatically available for detecting. Different permissions and restrictions can overlap.

    Source

    Data © USGS, BLM, USFWS, USFS; styling © Detector Maps™

    Legend

    BLM
    • Recreation Sites
    • Campground
    • Trail Head
    • OHV Area
    • Boat Launch / Ramp
    • Info / Visitor Center
    • Picnic Area
    • Scenic / POI
    • Water Access
    • Parking / Staging
    • Facilities (Other)
    • Admin Boundaries
    • Field Office Boundary
  • BLM Administrative Units in the Detector Maps app, USA coins and relics© Mapbox, © Maxar
    Land Use & AccessExplorer

    BLM Administrative Units

    Bureau of Land Management administrative boundaries including field offices and district offices.

    Read the write-up
    BLM Administrative Units in the Detector Maps app, USA coins and relics© Mapbox, © Maxar

    A screen from the Detector Maps app. Satellite imagery © Mapbox, © Maxar.

    Explorer. Opens with Explorer or Pro. On the Free plan it works inside your one free area of 250 km².

    Open in the app

    About this layer

    Bureau of Land Management administrative boundaries identify the offices or management units responsible for an area. Use them to find the right source of local information. The boundary does not mean every place inside it is open to detecting.

    What it is for

    Turn on the relevant layers together and read their legends and notes. Check current conditions with the land manager before planning a visit.

    Limits

    An unshaded area is not automatically available for detecting. Different permissions and restrictions can overlap.

    Source

    Data © USGS, BLM, USFWS, USFS; styling © Detector Maps™

    Legend

    BLM
    • Recreation Sites
    • Campground
    • Trail Head
    • OHV Area
    • Boat Launch / Ramp
    • Info / Visitor Center
    • Picnic Area
    • Scenic / POI
    • Water Access
    • Parking / Staging
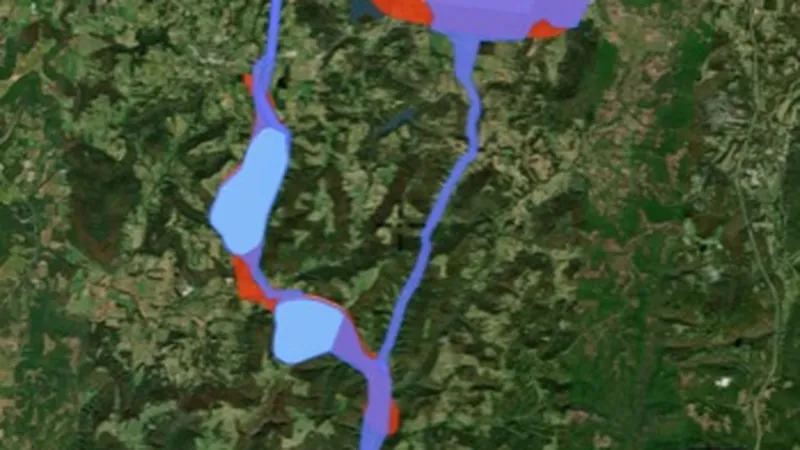
    • Facilities (Other)
    • Admin Boundaries
    • Field Office Boundary
  • Property Boundaries in the Detector Maps app, USA coins and relics© Mapbox, © Maxar
    Land Use & AccessPro

    Property Boundaries

    Property boundaries show how the land is divided into parcels.

    Read the write-up
    Property Boundaries in the Detector Maps app, USA coins and relics© Mapbox, © Maxar

    A screen from the Detector Maps app. Satellite imagery © Mapbox, © Maxar.

    Pro. Opens with Pro.

    Open in the app

    About this layer

    Property boundaries show how the land is divided into parcels. Use the outlines to identify the land you want to research and check the available parcel details. A boundary does not give permission to enter or establish a public route.

    What it is for

    Use the outlines to identify the parcel you want to research, then check the relevant land records and access arrangements.

    Limits

    Map boundaries can be approximate. A parcel outline does not identify a public route or give permission to enter.

    Source

    Data © USGS, BLM, USFWS, USFS; styling © Detector Maps™

    Legend

    Land Use & Access
    • Property Boundaries
    • PLSS Survey Grid
    • Surface Mgmt Agencies
    • BLM Recreation Sites
    • BLM Admin Units

    Draws from zoom 13.

Protected Areas

6
  • Military Areas in the Detector Maps app, USA coins and relics© Mapbox, © Maxar
    Protected AreasExplorer

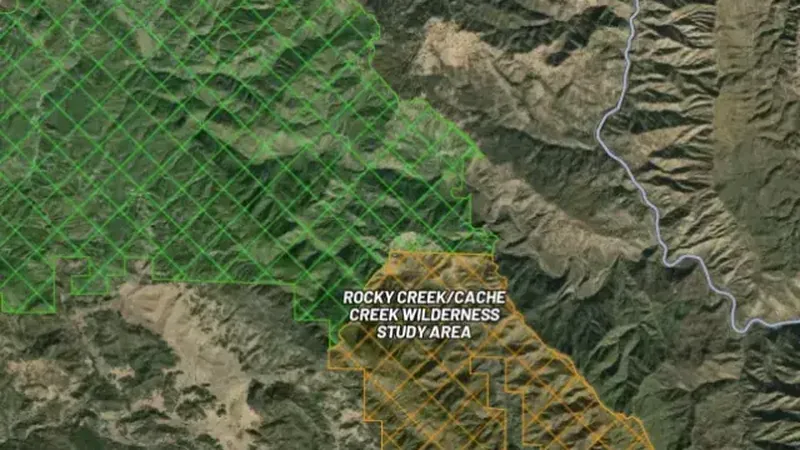
    Military Areas

    Active military installations and restricted zones. No public access. Detecting is strictly prohibited.

    Read the write-up
    Military Areas in the Detector Maps app, USA coins and relics© Mapbox, © Maxar

    A screen from the Detector Maps app. Satellite imagery © Mapbox, © Maxar.

    Explorer. Opens with Explorer or Pro. On the Free plan it works inside your one free area of 250 km².

    Open in the app

    About this layer

    Military area boundaries help identify land associated with military use. Check these early when planning access. A boundary is not permission to enter, and old or apparently unused areas can still have restrictions.

    What it is for

    Turn on the relevant layers together and read their legends and notes. Check current conditions with the land manager before planning a visit.

    Limits

    An unshaded area is not automatically available for detecting. Different permissions and restrictions can overlap.

    Source

    Data © USGS, BLM, USFWS, USFS; styling © Detector Maps™

    Legend

    Restricted Areas
    • Military
    • Critical Habitat
    • Wilderness Study Area
    • Wilderness Area
    • Nat. Monument / Conservation
    • Fish & Wildlife
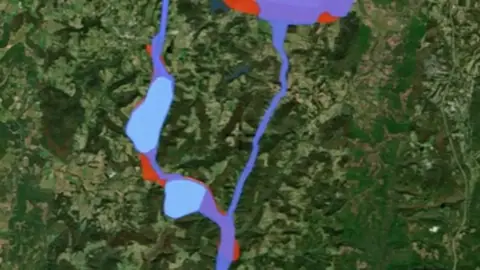
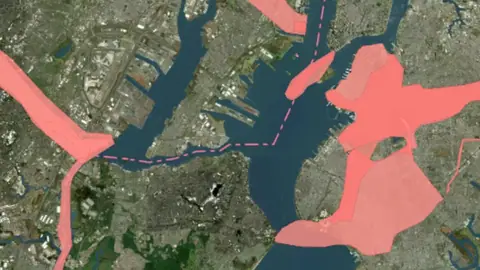
  • Critical Habitat Areas in USA coins and relics, drawn over satellite imagery© Mapbox, © Maxar
    Protected AreasExplorer

    Critical Habitat Areas

    Areas designated as critical habitat for threatened or endangered species. Ground disturbance may be restricted.

    Read the write-up
    Critical Habitat Areas in USA coins and relics, drawn over satellite imagery© Mapbox, © Maxar

    The layer drawn over satellite imagery. Satellite imagery © Mapbox, © Maxar.

    Explorer. Opens with Explorer or Pro. On the Free plan it works inside your one free area of 250 km².

    Open in the app

    About this layer

    Critical habitat areas show areas designated as important to particular species. Use the boundary to identify the designation around your location and check the responsible authority's current information. The map does not establish permission to enter or detect.

    What it is for

    Turn on the relevant layers together and read their legends and notes. Check current conditions with the land manager before planning a visit.

    Limits

    An unshaded area is not automatically available for detecting. Different permissions and restrictions can overlap.

    Source

    Data © USGS, BLM, USFWS, USFS; styling © Detector Maps™

    Legend

    Restricted Areas
    • Military
    • Critical Habitat
    • Wilderness Study Area
    • Wilderness Area
    • Nat. Monument / Conservation
    • Fish & Wildlife
  • Wilderness Study Areas in the Detector Maps app, USA coins and relics© Mapbox, © Maxar
    Protected AreasExplorer

    Wilderness Study Areas

    Wilderness Study Areas (WSAs) managed to preserve wilderness character. Mechanised equipment is generally prohibited.

    Read the write-up
    Wilderness Study Areas in the Detector Maps app, USA coins and relics© Mapbox, © Maxar

    A screen from the Detector Maps app. Satellite imagery © Mapbox, © Maxar.

    Explorer. Opens with Explorer or Pro. On the Free plan it works inside your one free area of 250 km².

    Open in the app

    About this layer

    Wilderness study areas show land being considered or managed for its wilderness characteristics. Use the boundary to identify the designation around your location and check the responsible authority's current information. The map does not establish permission to enter or detect.

    What it is for

    Turn on the relevant layers together and read their legends and notes. Check current conditions with the land manager before planning a visit.

    Limits

    An unshaded area is not automatically available for detecting. Different permissions and restrictions can overlap.

    Source

    Data © USGS, BLM, USFWS, USFS; styling © Detector Maps™

    Legend

    Restricted Areas
    • Military
    • Critical Habitat
    • Wilderness Study Area
    • Wilderness Area
    • Nat. Monument / Conservation
    • Fish & Wildlife
  • Wilderness Areas in the Detector Maps app, USA coins and relics© Mapbox, © Maxar
    Protected AreasExplorer

    Wilderness Areas

    Congressionally designated Wilderness Areas. No motorised or mechanised equipment allowed.

    Read the write-up
    Wilderness Areas in the Detector Maps app, USA coins and relics© Mapbox, © Maxar

    A screen from the Detector Maps app. Satellite imagery © Mapbox, © Maxar.

    Explorer. Opens with Explorer or Pro. On the Free plan it works inside your one free area of 250 km².

    Open in the app

    About this layer

    Wilderness areas show land designated for wilderness protection. Use the boundary to identify the designation around your location and check the responsible authority's current information. The map does not establish permission to enter or detect.

    What it is for

    Turn on the relevant layers together and read their legends and notes. Check current conditions with the land manager before planning a visit.

    Limits

    An unshaded area is not automatically available for detecting. Different permissions and restrictions can overlap.

    Source

    Data © USGS, BLM, USFWS, USFS; styling © Detector Maps™

    Legend

    Restricted Areas
    • Military
    • Critical Habitat
    • Wilderness Study Area
    • Wilderness Area
    • Nat. Monument / Conservation
    • Fish & Wildlife
  • National Monument Areas in USA coins and relics, drawn over satellite imagery© Mapbox, © Maxar
    Protected AreasExplorer

    National Monument Areas

    National Monuments and National Conservation Areas. Mining and mineral entry are typically withdrawn.

    Read the write-up
    National Monument Areas in USA coins and relics, drawn over satellite imagery© Mapbox, © Maxar

    The layer drawn over satellite imagery. Satellite imagery © Mapbox, © Maxar.

    Explorer. Opens with Explorer or Pro. On the Free plan it works inside your one free area of 250 km².

    Open in the app

    About this layer

    National monument areas show land designated for important natural, historic or scientific features. Use the boundary to identify the designation around your location and check the responsible authority's current information. The map does not establish permission to enter or detect.

    What it is for

    Turn on the relevant layers together and read their legends and notes. Check current conditions with the land manager before planning a visit.

    Limits

    An unshaded area is not automatically available for detecting. Different permissions and restrictions can overlap.

    Source

    Data © USGS, BLM, USFWS, USFS; styling © Detector Maps™

    Legend

    Restricted Areas
    • Military
    • Critical Habitat
    • Wilderness Study Area
    • Wilderness Area
    • Nat. Monument / Conservation
    • Fish & Wildlife
  • Fish & Wildlife Areas in USA coins and relics, drawn over satellite imagery© Mapbox, © Maxar
    Protected AreasExplorer

    Fish & Wildlife Areas

    National Wildlife Refuges managed by U.S. Fish & Wildlife Service. Detecting is generally not permitted.

    Read the write-up
    Fish & Wildlife Areas in USA coins and relics, drawn over satellite imagery© Mapbox, © Maxar

    The layer drawn over satellite imagery. Satellite imagery © Mapbox, © Maxar.

    Explorer. Opens with Explorer or Pro. On the Free plan it works inside your one free area of 250 km².

    Open in the app

    About this layer

    Fish and wildlife areas show land managed for wildlife or habitat purposes. Use the boundary to identify the designation around your location and check the responsible authority's current information. The map does not establish permission to enter or detect.

    What it is for

    Turn on the relevant layers together and read their legends and notes. Check current conditions with the land manager before planning a visit.

    Limits

    An unshaded area is not automatically available for detecting. Different permissions and restrictions can overlap.

    Source

    Data © USGS, BLM, USFWS, USFS; styling © Detector Maps™

    Legend

    Restricted Areas
    • Military
    • Critical Habitat
    • Wilderness Study Area
    • Wilderness Area
    • Nat. Monument / Conservation
    • Fish & Wildlife

Contours

1
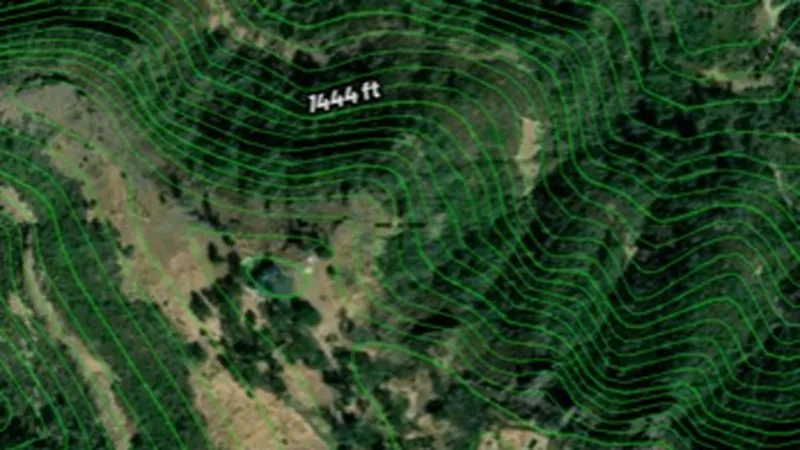
  • Contours in the Detector Maps app, USA coins and relics© Mapbox, © Maxar
    ContoursExplorer

    Contours

    Contour lines join places at the same height.

    Read the write-up
    Contours in the Detector Maps app, USA coins and relics© Mapbox, © Maxar

    A screen from the Detector Maps app. Satellite imagery © Mapbox, © Maxar.

    Explorer. Opens with Explorer or Pro. On the Free plan it works inside your one free area of 250 km².

    Open in the app

    About this layer

    Contour lines join places at the same height. Closely spaced lines usually show steeper ground; wider gaps show gentler slopes. Use the height labels and nearby waterways to understand ridges, valleys and possible routes.

    What it is for

    Closely spaced lines indicate steeper ground. Use the labels and terrain together to understand ridges, slopes and valleys.

    Limits

    Contours simplify the terrain at their map scale. Small workings, obstacles and local hazards may not appear.

    Source

    Data © USGS, BLM, USFWS, USFS; styling © Detector Maps™

    Legend

    Contours
    • Contour Lines

Terrain+™ LiDAR

2
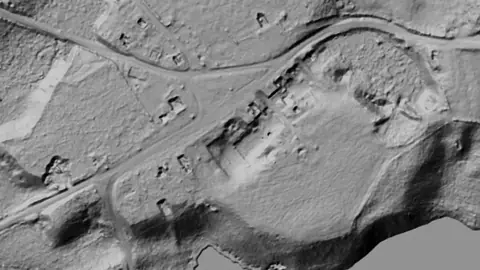
  • Terrain+™ Analysis in USA coins and relics, drawn over satellite imagery© Mapbox, © Maxar
    Terrain+™ LiDARPro

    Terrain+™ Analysis

    Outline an area of any shape up to 3 miles across over USGS 1 m lidar and see the ground full screen as a 3D surface, with a VE slider to raise or flatten it. Any layer can be draped over it. It shows Dynamic LiDAR™, turned on as it is built, and its LiDAR button sets Dynamic LiDAR™'s look on the model and the map alike: hillshade, slope, local relief, sky view and openness, multi-scale relief, VAT, red relief, Multi-Light PCA or the SVF/LRM Composite, each with settings to bring out the features you are after. Save a model with the button beside the X to keep it on the phone for 30 days and open it from the Terrain+™ LiDAR menu in the field, without a connection.

    Read the write-up
    Terrain+™ Analysis in USA coins and relics, drawn over satellite imagery© Mapbox, © Maxar

    Terrain+ builds a 3D model of an outlined area and shows Dynamic LiDAR on it. This is that Dynamic LiDAR look (Dana Common, Massachusetts), not a 3D screenshot. Satellite imagery © Mapbox, © Maxar.

    Pro. Opens with Pro.

    Open in the app

    About this layer

    Terrain+™ Analysis builds a 3D model of an area of ground you outline, any shape up to 3 miles across, from the USGS 1 m lidar. Raise the VE slider to make low banks, pits and hollows easier to see and drape any layer over the model. It shows Dynamic LiDAR™ in the look you choose, such as local relief, sky view or VAT. The model shows the ground surface the lidar measured, not what lies beneath it.

    What it is for

    Tap round the area you want to model, build it, then tilt, turn and raise the VE slider to bring out low banks, pits and hollows. Drape any layer over it. The model shows Dynamic LiDAR™, turned on as it is built: its LiDAR button sets the look (hillshade, slope, local relief, sky view and openness, VAT and more), each with settings to bring out the features you are after.

    Limits

    The model shows the ground surface the lidar measured, not what lies beneath it. Detail and dates vary between surveys, and gaps are filled from the ground around them.

    Source

    Data © USGS, BLM, USFWS, USFS; styling © Detector Maps™

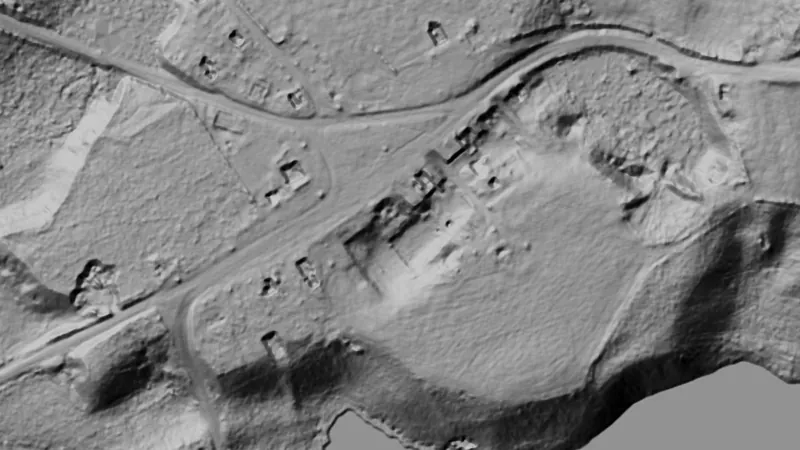
  • Dynamic LiDAR™ in USA coins and relics, drawn over satellite imagery© Mapbox, © Maxar
    Terrain+™ LiDARPro

    Dynamic LiDAR™

    Dynamic LiDAR™ draws the USGS's 1 m lidar over the map on the phone as you move, from zoom 11 in, in any of Terrain+™'s relief renderings (hillshade, slope, local relief, sky view and openness, multi-scale relief, VAT and red relief), Multi-Light PCA or the SVF/LRM Composite.

    Read the write-up
    Dynamic LiDAR™ in USA coins and relics, drawn over satellite imagery© Mapbox, © Maxar

    Drawn by the app's own engine from the live survey files at Dana Common, Massachusetts. Satellite imagery © Mapbox, © Maxar.

    Pro. Opens with Pro.

    Open in the app

    About this layer

    Dynamic LiDAR™ draws the USGS's 1 m lidar over the map on the phone as you move, from zoom 11 in, in any of Terrain+™'s relief renderings (hillshade, slope, local relief, sky view and openness, multi-scale relief, VAT and red relief), Multi-Light PCA or the SVF/LRM Composite. Change a rendering's settings with the LiDAR button or in Active Layers and the map redraws straight away. Where the USGS has no 1 m lidar the map stays clear. It shows the ground surface the lidar measured, not what lies beneath it.

    What it is for

    Open its filter in Active Layers and choose a rendering from the pictures, drawn from the ground in the middle of the view. Move a setting and the map redraws: a lower sun for faint banks, a radius about the width of the features you are after.

    Limits

    It shows the ground surface the lidar measured, not what lies beneath it. It needs a connection, and new ground takes a moment to draw.

    Source

    Data © USGS, BLM, USFWS, USFS; styling © Detector Maps™

    Draws from zoom 11.

Sources

Where the data comes from.

Every card names its source. The sources named on this page are:

  • Data © USGS, BLM, USFWS, USFS; styling © Detector Maps™

Satellite imagery © Mapbox, © Maxar. Layer data from the sources named on each card.

Plans

What the pills mean.

Every layer shows the plan that opens it. The free plan never runs out. Prices are shown once, here.

Free

Open on every plan, forever. Includes ghost towns and old topo maps.

Explorer

Opens every base layer, and offline maps for the areas you choose. $59.99 a year or $7.99 a month.

Pro

Dynamic LiDAR and Terrain+ 3D models. Property boundaries with landowner names. Starting a land permission from a parcel. $99.99 a year or $11.99 a month.

7-day free trial on yearly plans · Nothing charged until it ends · Cancel anytime.

Prices are in US dollars.

Satellite imagery © Mapbox, © Maxar. Layer data from the sources named on each card.

Get Detector Maps

Plan the next trip tonight.

Free to download on iPhone and Android.

On iPhone? Get it on the App StoreOn Android? Get it on Google Play

Free to download on iPhone and Android.

7-day free trial on yearly plans · Nothing charged until it ends · Cancel anytime.

Scan with your phone camera to get the app
Start free trialOpen the web map

On your phone: App Store · Google Play

7-day free trial on yearly plans · Nothing charged until it ends · Cancel anytime.

Or open the web map

The Detector Maps support inbox is staffed by Matt and Tom, the two brothers who built it. Contact us

Scan with your phone camera to get the app