Gold Anomaly Catchments
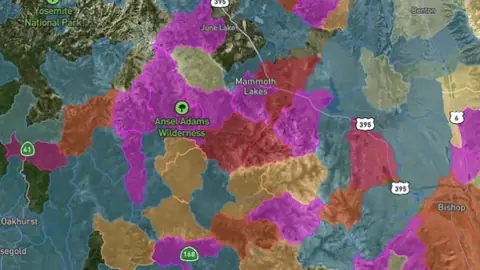
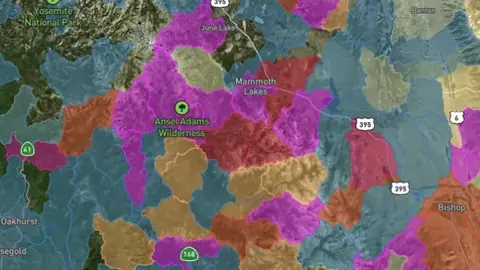
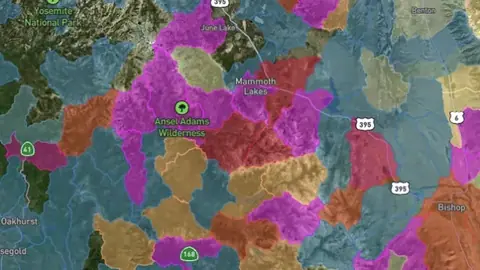
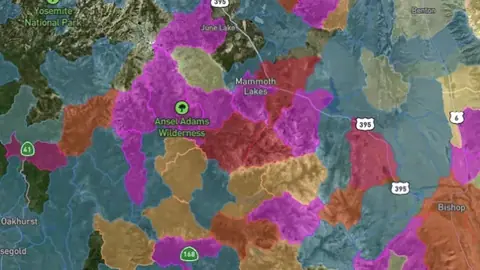
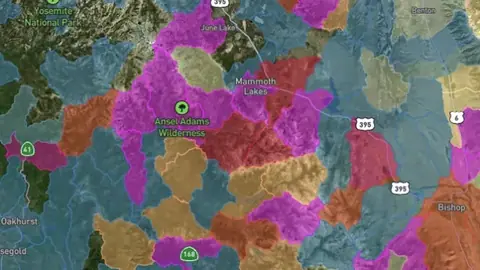
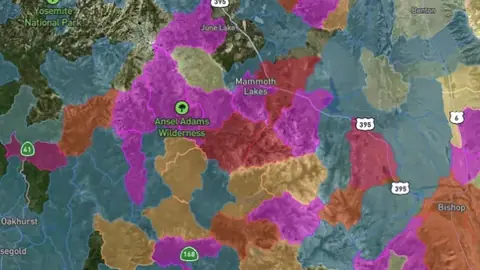
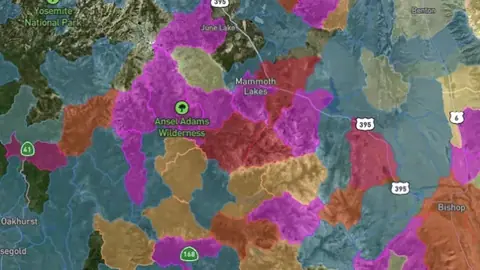
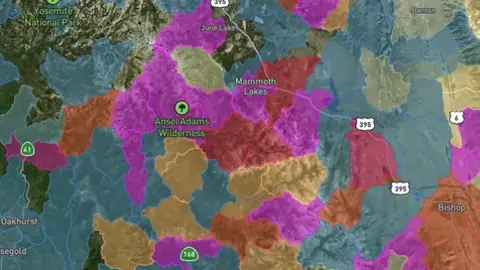
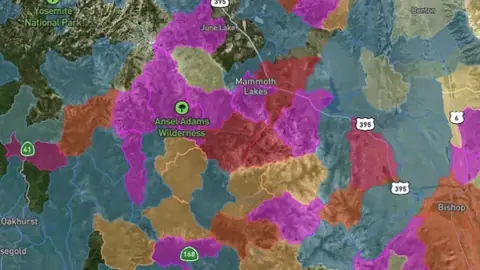
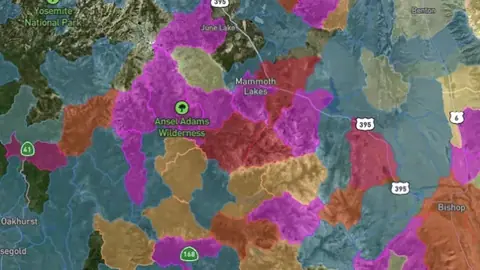
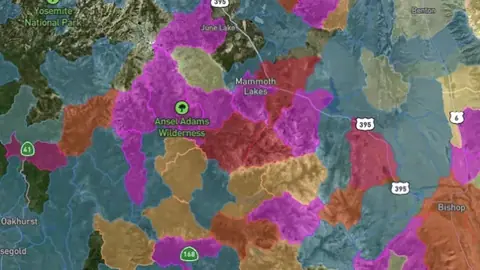
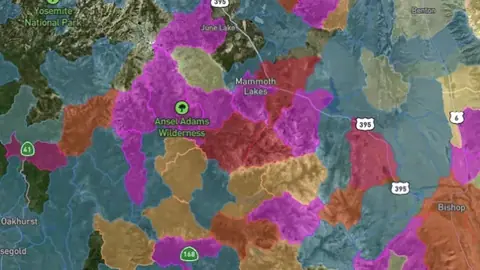
Catchment areas showing the maximum recorded gold value based on stream geochemistry. Brighter catchments indicate higher gold potential.
On iPhone? Get it on the App StoreOn Android? Get it on Google Play
Free to download on iPhone and Android.
7-day free trial on yearly plans · Nothing charged until it ends · Cancel anytime.
On your phone: App Store · Google Play
7-day free trial on yearly plans · Nothing charged until it ends · Cancel anytime.
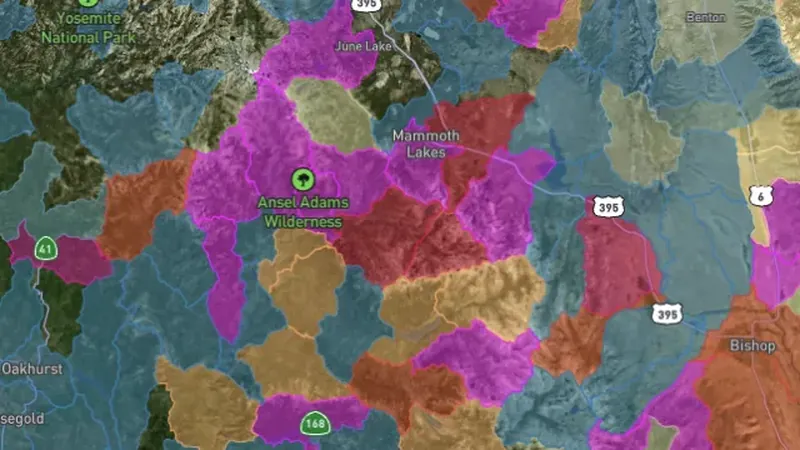 © Mapbox, © Maxar
Satellite imagery © Mapbox, © Maxar. Layer data from the sources named on each card.
About this layer
A catchment is the area that drains towards a creek or outlet. This layer helps connect gold-related readings with the ground upstream that may have supplied them. A highlighted catchment can contain a lot of ground that has not been tested.
What it is for
Use the legend to compare areas, then check geology, known records and access before choosing where to investigate.
Limits
A higher-ranked area is a research lead, not a guaranteed find. A lower-ranked or blank area does not prove an absence of gold.
Where it works in USA gold.
Drawn in each state.
 © Mapbox, © MaxarAlabama Explorer
 © Mapbox, © MaxarAlaska Explorer
 © Mapbox, © MaxarArizona Explorer
 © Mapbox, © MaxarCalifornia Explorer
 © Mapbox, © MaxarColorado Explorer
 © Mapbox, © MaxarGeorgia Explorer
 © Mapbox, © MaxarIdaho Explorer
 © Mapbox, © MaxarMontana Explorer
 © Mapbox, © MaxarNevada Explorer
 © Mapbox, © MaxarNew Mexico Explorer
 © Mapbox, © MaxarNorth Carolina Explorer
 © Mapbox, © MaxarOregon Explorer
 © Mapbox, © MaxarSouth Carolina Explorer
 © Mapbox, © MaxarUtah Explorer
 © Mapbox, © MaxarVirginia Explorer
 © Mapbox, © MaxarWashington Explorer
Satellite imagery © Mapbox, © Maxar. Layer data from the sources named on each card.
Where the data comes from.
Data provided by the U.S. Geological Survey (USGS), Bureau of Land Management (BLM), U.S. Forest Service (USFS), and ReportAll USA (Licensed), licensed under USGS Public Domain and other applicable licenses USGS Public Domain
Data provided by the U.S. Geological Survey (USGS), the Alaska Division of Geological & Geophysical Surveys (DGGS), the Alaska Department of Natural Resources (DNR), Bureau of Land Management (BLM), U.S. Forest Service (USFS), and ReportAll USA (Licensed), licensed under USGS Public Domain and other applicable licenses USGS Public Domain
How it is drawn.
- Low
- Medium
- High
What the pills mean.
Every layer shows the plan that opens it. The free plan never runs out. Prices are shown once, here.
Open on every plan, forever. Includes gold records.
Opens every base layer, and offline maps for the areas you choose. $59.99 a year or $7.99 a month.
Dynamic LiDAR and Terrain+ 3D models. Property boundaries with landowner names. Claim alerts. $99.99 a year or $11.99 a month.
7-day free trial on yearly plans · Nothing charged until it ends · Cancel anytime.
Prices are in US dollars.
Satellite imagery © Mapbox, © Maxar. Layer data from the sources named on each card.
Plan the next trip tonight.
Free to download on iPhone and Android.
On iPhone? Get it on the App StoreOn Android? Get it on Google Play
Free to download on iPhone and Android.
7-day free trial on yearly plans · Nothing charged until it ends · Cancel anytime.
On your phone: App Store · Google Play
7-day free trial on yearly plans · Nothing charged until it ends · Cancel anytime.
The Detector Maps support inbox is staffed by Matt and Tom, the two brothers who built it. Contact us