Rock Chips
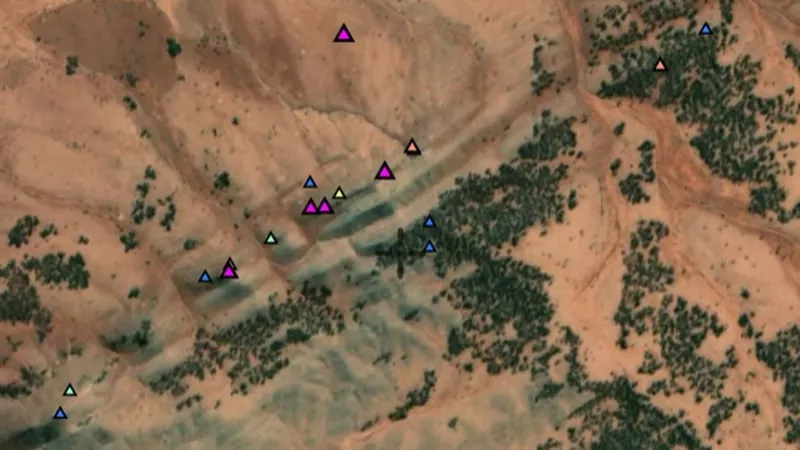
Gold concentration in exposed rock samples, measured in ppm.
On iPhone? Get it on the App StoreOn Android? Get it on Google Play
Free to download on iPhone and Android.
7-day free trial on yearly plans · Nothing charged until it ends · Cancel anytime.
On your phone: App Store · Google Play
7-day free trial on yearly plans · Nothing charged until it ends · Cancel anytime.
 © Mapbox, © Maxar
Satellite imagery © Mapbox, © Maxar. Layer data from the sources named on each card.
About this layer
Rock samples show laboratory results from pieces of rock collected for testing. Compare neighbouring samples to see whether an interesting result follows a rock unit or a vein. One rich sample may not represent the surrounding ground.
What it is for
Compare nearby samples and the mapped rock units. Open the record, where available, to check the sample description.
Limits
A selected rock sample may not represent the surrounding ground. Check units before comparing it with soil or stream readings.
Where it works in Australia.
Drawn in each state.
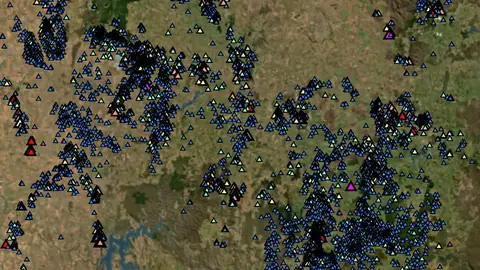 © Mapbox, © MaxarNew South Wales Explorer
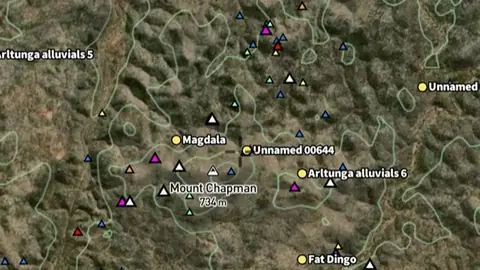 © Mapbox, © MaxarNorthern Territory Explorer
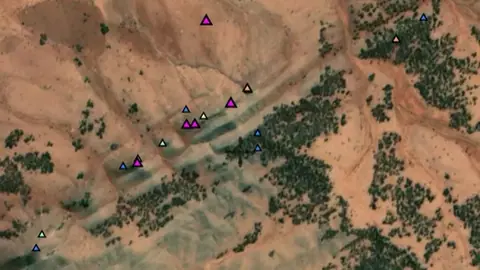 © Mapbox, © MaxarSouth Australia Explorer
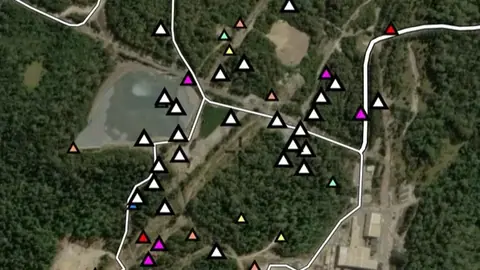 © Mapbox, © MaxarTasmania Explorer
Satellite imagery © Mapbox, © Maxar. Layer data from the sources named on each card.
Where the data comes from.
Data provided by The State of New South Wales (Geological Survey of NSW, GSNSW, Dept of Planning and Environment, Forestry Corporation of NSW, Spatial Services NSW, Department of Regional NSW), licensed under CC BY 4.0
Data provided by Northern Territory of Australia (Northern Territory Geological Survey) 2025, licensed under CC BY 4.0
Data provided by the State of South Australia (The Department for Energy and Mining 2024, Department for Housing and Urban Development 2024, Deparment of Environment and Water 2024), licensed under CC BY 4.0
Data provided by The State of Tasmania (theLIST) 024, licensed under CC BY 4.0
How it is drawn.
- Low Gold 0.01
- 0.02
- 0.1
- Medium Gold 0.25
- 0.5
- 1
- High Gold 10
Filters in the app
What the pills mean.
Every layer shows the plan that opens it. The free plan never runs out. Prices are shown once, here.
Open on every plan, forever. Includes gold records.
Opens every base layer, and offline maps for the areas you choose. A$99 a year or A$9.99 a month.
Tenement alerts for a drawn area or a whole state. Report search across decades of exploration reports. A$249 a year or A$34.99 a month.
A layer sold on its own: the Victorian LiDAR add-on, A$39.99 a year.
7-day free trial on yearly plans · Nothing charged until it ends · Cancel anytime.
Satellite imagery © Mapbox, © Maxar. Layer data from the sources named on each card.
Plan the next trip tonight.
Free to download on iPhone and Android.
On iPhone? Get it on the App StoreOn Android? Get it on Google Play
Free to download on iPhone and Android.
7-day free trial on yearly plans · Nothing charged until it ends · Cancel anytime.
On your phone: App Store · Google Play
7-day free trial on yearly plans · Nothing charged until it ends · Cancel anytime.
The Detector Maps support inbox is staffed by Matt and Tom, the two brothers who built it. Contact us