Map library · Australia

South Australia map layers

27 layers for gold prospecting in South Australia, in 13 categories. 2 are free on every plan: Historic Gold Occurrences and Mineral Leases. 24 more open with Explorer. 1 needs Pro.

11 of these are also in other states in Australia. Each links to one page that lists them all.

27 layers13 categoriesFree 2Explorer 24Pro 1

Other states

On iPhone? Get it on the App StoreOn Android? Get it on Google Play

Free to download on iPhone and Android.

7-day free trial on yearly plans · Nothing charged until it ends · Cancel anytime.

Scan with your phone camera to get the app
Start free trialOpen the web map

On your phone: App Store · Google Play

7-day free trial on yearly plans · Nothing charged until it ends · Cancel anytime.

4.7 / 5 from 2,400+ ratings on the App Store and Google Play · 10,000+ prospectors and detectorists
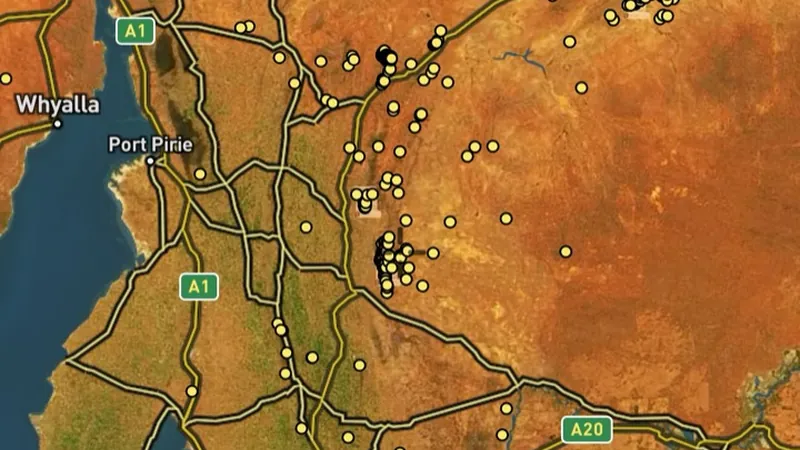
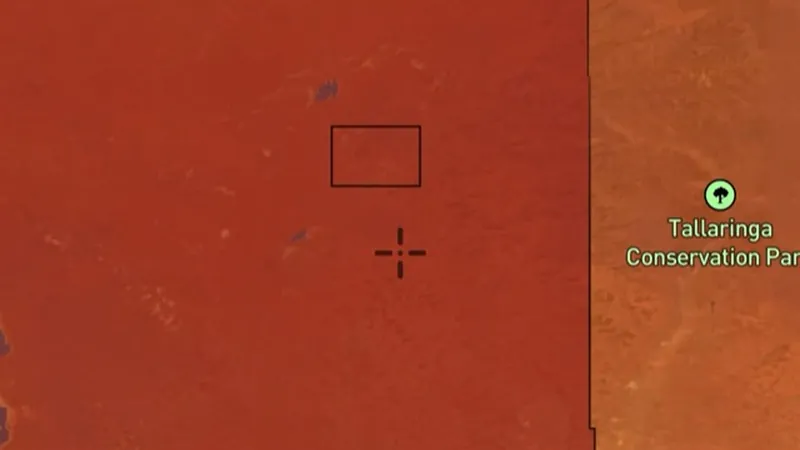
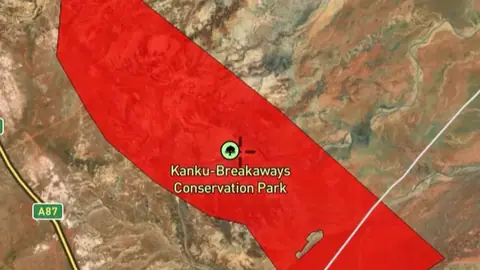
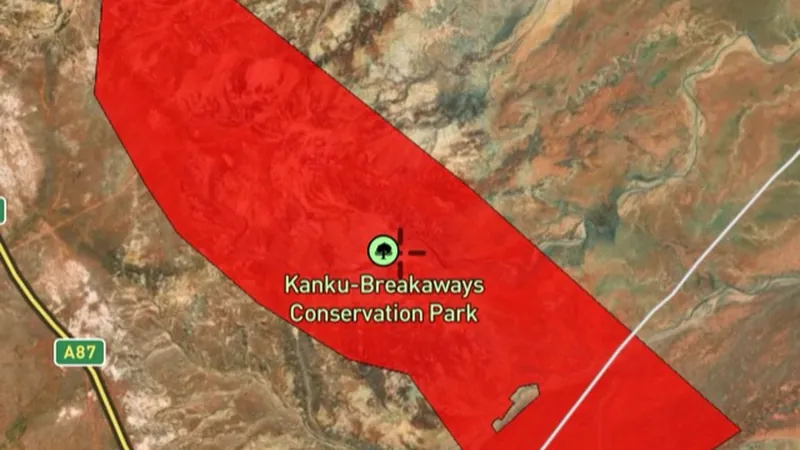
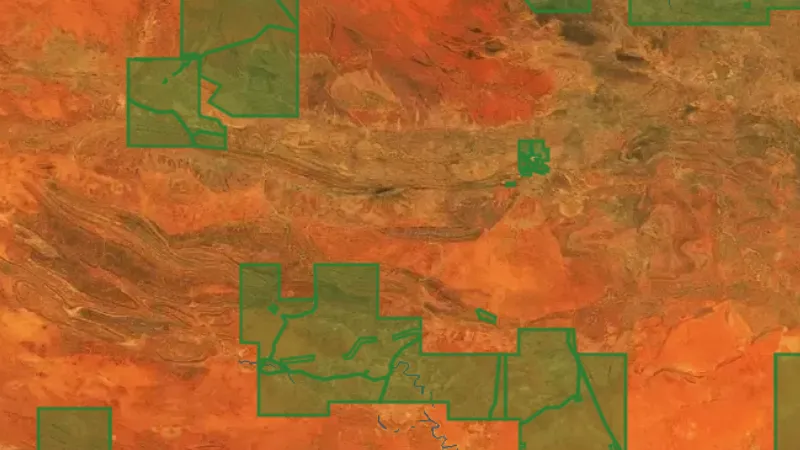
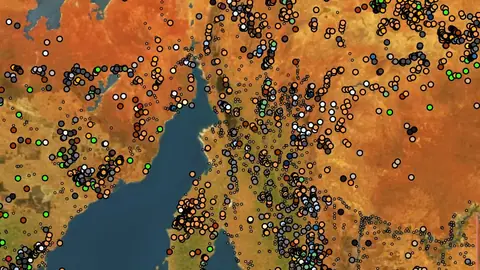
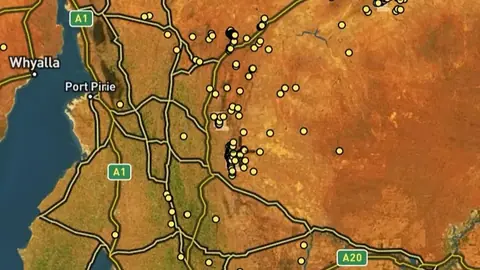
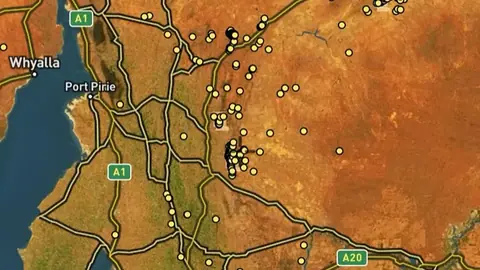
Historic Gold Occurrences in the Detector Maps app, South Australia© Mapbox, © Maxar

Satellite imagery © Mapbox, © Maxar. Layer data from the sources named on each card.

Satellite imagery © Mapbox, © Maxar. Layer data from the sources named on each card.

Historic Gold

2
  • Historic Gold Occurrences in the Detector Maps app, South Australia© Mapbox, © Maxar
    Historic GoldFree

    Historic Gold Occurrences

    Official records of past gold finds, old mines and workings.

    Read the write-up
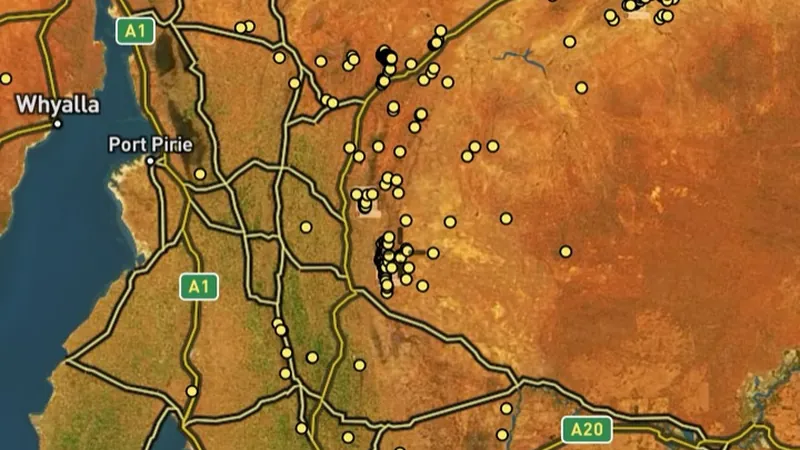
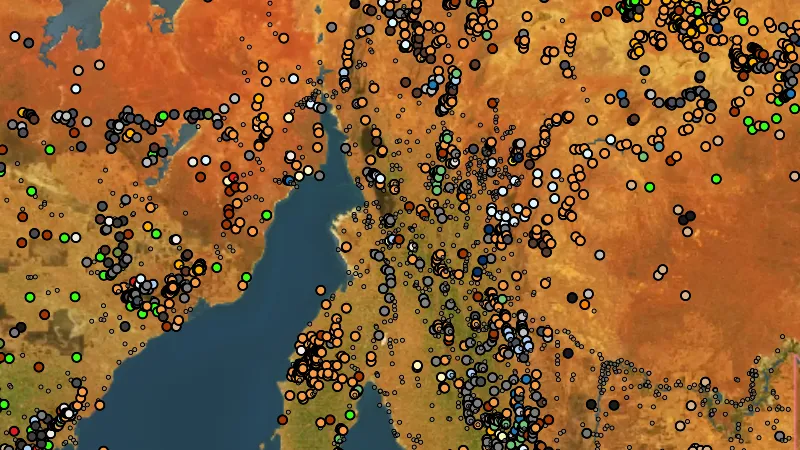
    Historic Gold Occurrences in the Detector Maps app, South Australia© Mapbox, © Maxar

    A screen from the Detector Maps app. Satellite imagery © Mapbox, © Maxar.

    Free. Opens on every plan, including Free.

    Open in the app

    About this layer

    Recorded gold finds and gold-bearing sites show where gold has been reported before. Compare nearby records with creeks, slopes and rock types to choose an area to research. A past find does not tell you how much gold remains.

    What it is for

    Look for patterns across several records, then compare them with creeks, slopes and geology.

    Limits

    Historic locations can be approximate. Past finds do not guarantee gold remains or that it is within detector depth.

    Source

    Data provided by the State of South Australia (The Department for Energy and Mining 2024, Department for Housing and Urban Development 2024, Deparment of Environment and Water 2024), licensed under CC BY 4.0

    Legend

    Historic Gold
    • Gold Occurrences
    • Historic References
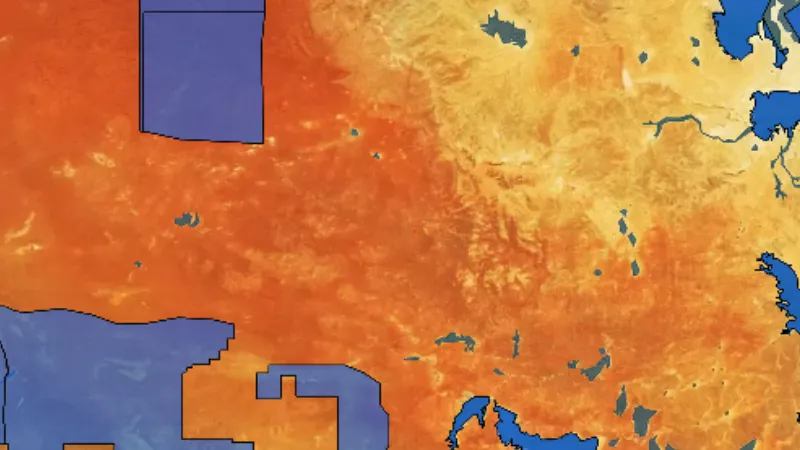
  • Historic Gold Nuggets in the Detector Maps app, South Australia© Mapbox, © Maxar
    Historic GoldExplorer

    Historic Gold Nuggets

    Reported locations of larger nugget finds (Trove).

    Also in 1 other state in Australia
    Read the write-up
    Historic Gold Nuggets in the Detector Maps app, South Australia© Mapbox, © Maxar

    A screen from the Detector Maps app. Satellite imagery © Mapbox, © Maxar.

    Explorer. Opens with Explorer or Pro. On the Free plan it works inside your one free area of 250 km².

    Open in the app

    This layer works the same way in 2 places in Australia, so its full write-up, legend and plan are on one page.

    Read the full write-up

    Source in South Australia

    Data provided by the State of South Australia (The Department for Energy and Mining 2024, Department for Housing and Urban Development 2024, Deparment of Environment and Water 2024), licensed under CC BY 4.0

Mining Boundaries & Areas

2
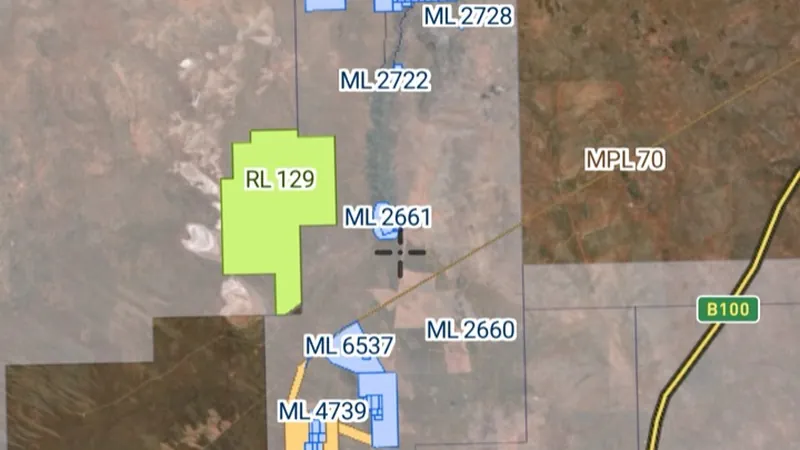
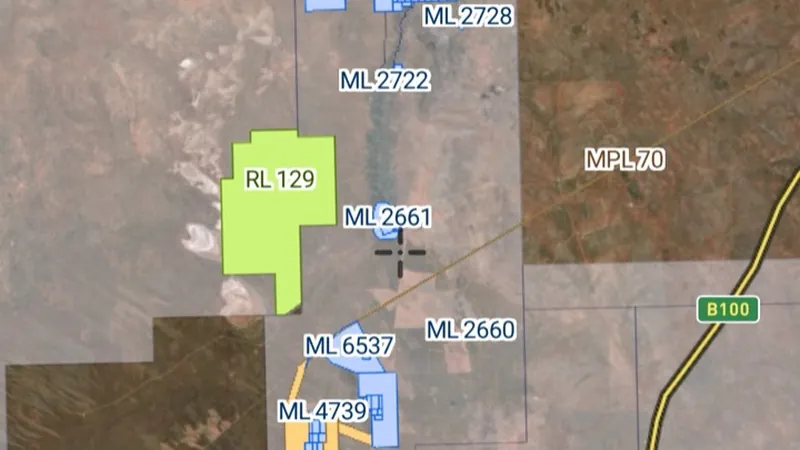
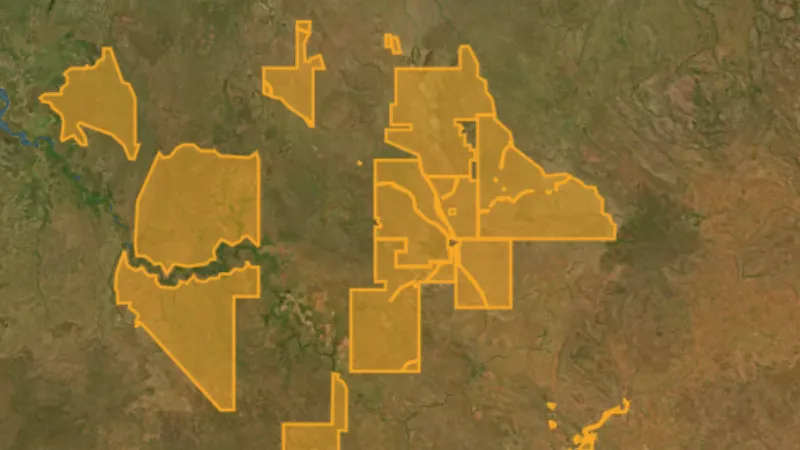
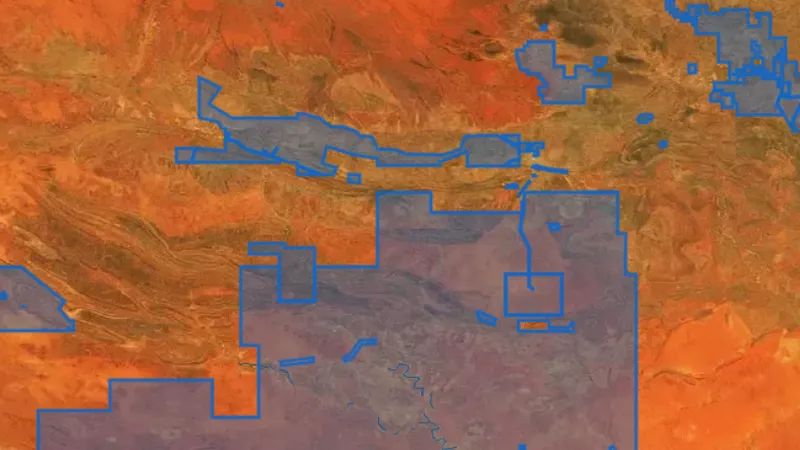
  • Mineral Leases in the Detector Maps app, South Australia© Mapbox, © Maxar
    Mining Boundaries & AreasFree

    Mineral Leases

    Granted mining title areas. Usually not suitable for recreational fossicking.

    Read the write-up
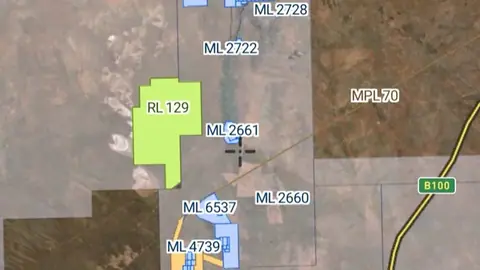
    Mineral Leases in the Detector Maps app, South Australia© Mapbox, © Maxar

    A screen from the Detector Maps app. Satellite imagery © Mapbox, © Maxar.

    Free. Opens on every plan, including Free.

    Open in the app

    About this layer

    Mining leases identify areas covered by recorded mining rights. Compare them with your intended location and inspect the available lease details. Confirm the current status and permissions before planning work on the land.

    What it is for

    Check the legend, status and available record details. Confirm the current record and relevant access arrangements before visiting.

    Limits

    Applications and granted rights are different. A mapped boundary alone does not tell you whether detecting is permitted.

    Source

    Data provided by the State of South Australia (The Department for Energy and Mining 2024, Department for Housing and Urban Development 2024, Deparment of Environment and Water 2024), licensed under CC BY 4.0

    Updated daily 6AM local time.

    Legend

    Mining Boundaries
    • Mineral Lease
    • Mineral Claim
    • Extractive Lease
    • Olympic Dam
    • Private Mine
    • Minreak/Opal Explore Licence

    Filters in the app

    Expiry filter
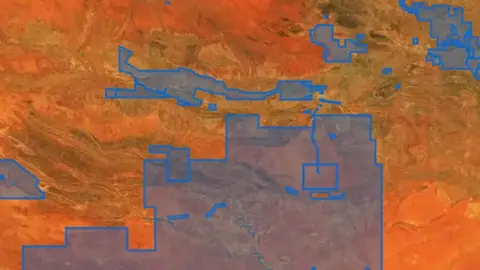
  • Mineral / Opal Exploration Licences in the Detector Maps app, South Australia© Mapbox, © Maxar
    Mining Boundaries & AreasExplorer

    Mineral / Opal Exploration Licences

    Granted exploration title areas including opal. Generally inaccessible without permission.

    Read the write-up
    Mineral / Opal Exploration Licences in the Detector Maps app, South Australia© Mapbox, © Maxar

    A screen from the Detector Maps app. Satellite imagery © Mapbox, © Maxar.

    Explorer. Opens with Explorer or Pro. On the Free plan it works inside your one free area of 250 km².

    Open in the app

    About this layer

    Exploration permits or licences identify areas covered by rights to investigate minerals. They help you understand where exploration interests overlap your plans. An exploration boundary does not automatically allow or prohibit your particular activity.

    What it is for

    Check the legend, status and available record details. Confirm the current record and relevant access arrangements before visiting.

    Limits

    Applications and granted rights are different. A mapped boundary alone does not tell you whether detecting is permitted.

    Source

    Data provided by the State of South Australia (The Department for Energy and Mining 2024, Department for Housing and Urban Development 2024, Deparment of Environment and Water 2024), licensed under CC BY 4.0

    Updated daily 6AM local time.

    Legend

    Mining Boundaries
    • Mineral Lease
    • Mineral Claim
    • Extractive Lease
    • Olympic Dam
    • Private Mine
    • Minreak/Opal Explore Licence

    Filters in the app

    Expiry filter

Geochemistry

4
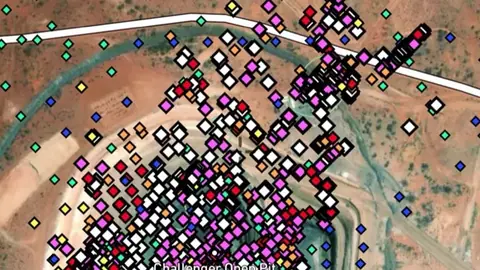
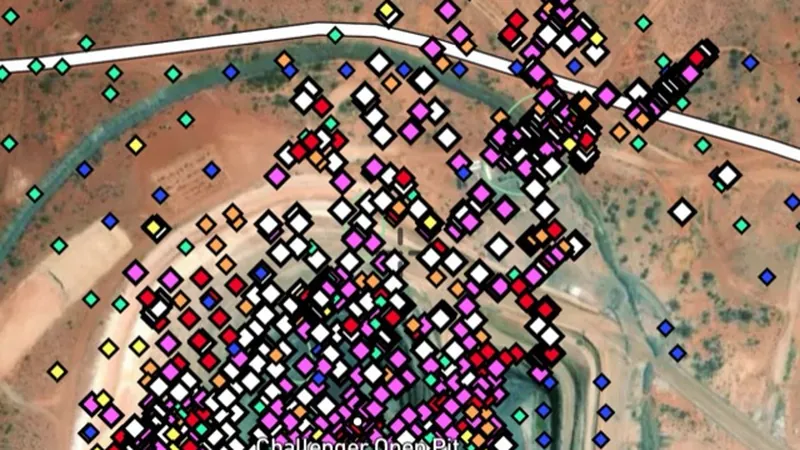
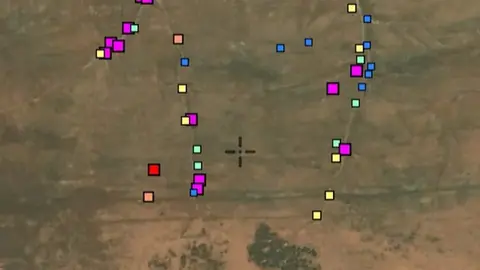
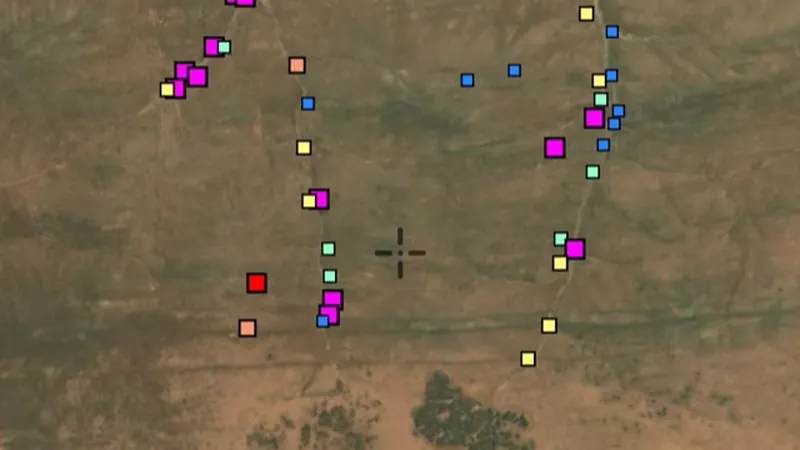
  • Max Downhole Gold in the Detector Maps app, South Australia© Mapbox, © Maxar
    GeochemistryExplorer

    Max Downhole Gold

    Highest gold value recorded in each drillhole.

    Also in 1 other state in Australia
    Read the write-up
    Max Downhole Gold in the Detector Maps app, South Australia© Mapbox, © Maxar

    A screen from the Detector Maps app. Satellite imagery © Mapbox, © Maxar.

    Explorer. Opens with Explorer or Pro. On the Free plan it works inside your one free area of 250 km².

    Open in the app

    This layer works the same way in 2 places in Australia, so its full write-up, legend and plan are on one page.

    Read the full write-up

    Source in South Australia

    Data provided by the State of South Australia (The Department for Energy and Mining 2024, Department for Housing and Urban Development 2024, Deparment of Environment and Water 2024), licensed under CC BY 4.0

    Filters in the app

    Soil sample filters
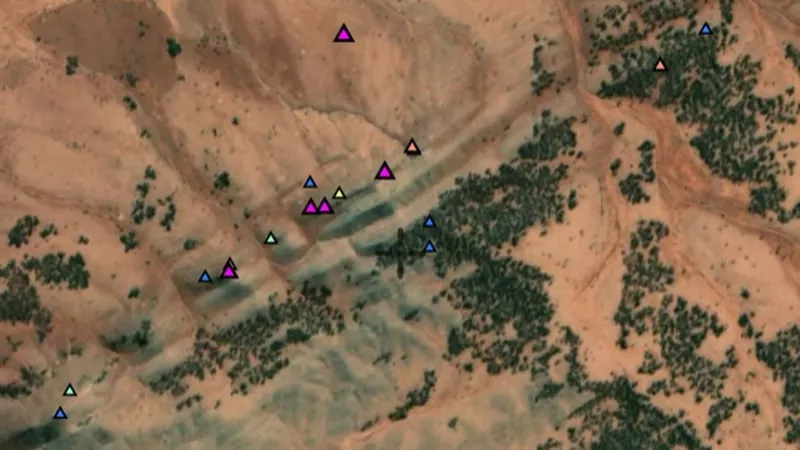
  • Rock Chips in the Detector Maps app, South Australia© Mapbox, © Maxar
    GeochemistryExplorer

    Rock Chips

    Gold concentration in exposed rock samples, measured in ppm.

    Also in 3 other states in Australia
    Read the write-up
    Rock Chips in the Detector Maps app, South Australia© Mapbox, © Maxar

    A screen from the Detector Maps app. Satellite imagery © Mapbox, © Maxar.

    Explorer. Opens with Explorer or Pro. On the Free plan it works inside your one free area of 250 km².

    Open in the app

    This layer works the same way in 4 places in Australia, so its full write-up, legend and plan are on one page.

    Read the full write-up

    Source in South Australia

    Data provided by the State of South Australia (The Department for Energy and Mining 2024, Department for Housing and Urban Development 2024, Deparment of Environment and Water 2024), licensed under CC BY 4.0

    Filters in the app

    Soil sample filters
  • Streams in the Detector Maps app, South Australia© Mapbox, © Maxar
    GeochemistryExplorer

    Streams

    Gold concentration in creek sediment samples (ppb).

    Also in 2 other states in Australia
    Read the write-up
    Streams in the Detector Maps app, South Australia© Mapbox, © Maxar

    A screen from the Detector Maps app. Satellite imagery © Mapbox, © Maxar.

    Explorer. Opens with Explorer or Pro. On the Free plan it works inside your one free area of 250 km².

    Open in the app

    This layer works the same way in 3 places in Australia, so its full write-up, legend and plan are on one page.

    Read the full write-up

    Source in South Australia

    Data provided by the State of South Australia (The Department for Energy and Mining 2024, Department for Housing and Urban Development 2024, Deparment of Environment and Water 2024), licensed under CC BY 4.0

    Filters in the app

    Soil sample filters
  • Soils in the Detector Maps app, South Australia© Mapbox, © Maxar
    GeochemistryExplorer

    Soils

    Gold concentrations in soil samples taken by exploration companies.

    Also in 1 other state in Australia
    Read the write-up
    Soils in the Detector Maps app, South Australia© Mapbox, © Maxar

    A screen from the Detector Maps app. Satellite imagery © Mapbox, © Maxar.

    Explorer. Opens with Explorer or Pro. On the Free plan it works inside your one free area of 250 km².

    Open in the app

    This layer works the same way in 2 places in Australia, so its full write-up, legend and plan are on one page.

    Read the full write-up

    Source in South Australia

    Data provided by the State of South Australia (The Department for Energy and Mining 2024, Department for Housing and Urban Development 2024, Deparment of Environment and Water 2024), licensed under CC BY 4.0

    Filters in the app

    Soil sample filters

Land Use & Access

6
  • Aboriginal Land in the Detector Maps app, South Australia© Mapbox, © Maxar
    Land Use & AccessExplorer

    Aboriginal Land

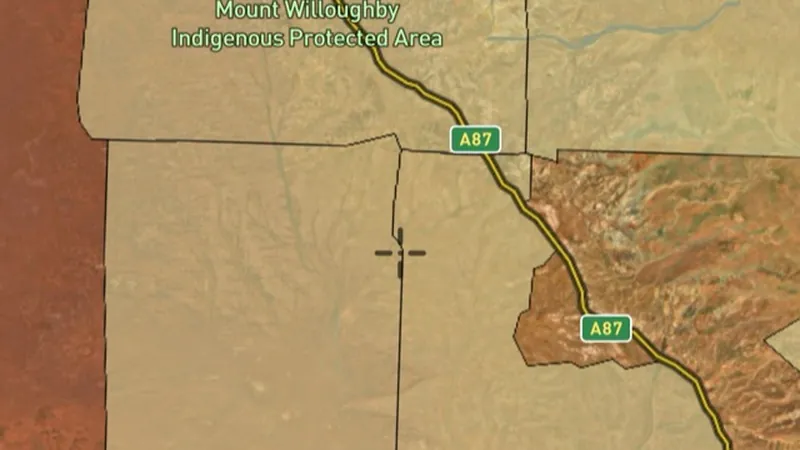
    Aboriginal land and reserves with their own access rules. May require permissions before entry.

    Read the write-up
    Aboriginal Land in the Detector Maps app, South Australia© Mapbox, © Maxar

    A screen from the Detector Maps app. Satellite imagery © Mapbox, © Maxar.

    Explorer. Opens with Explorer or Pro. On the Free plan it works inside your one free area of 250 km².

    Open in the app

    About this layer

    These boundaries identify the Indigenous land or reserve areas named in the layer. Use them to identify where further information and permission checks are needed. They do not create a right to enter or detect.

    What it is for

    Turn on the relevant layers together and read their legends and notes. Check current conditions with the land manager before planning a visit.

    Limits

    An unshaded area is not automatically available for detecting. Different permissions and restrictions can overlap.

    Source

    Data provided by the State of South Australia (The Department for Energy and Mining 2024, Department for Housing and Urban Development 2024, Deparment of Environment and Water 2024), licensed under CC BY 4.0

    Legend

    Aboriginal Land
    • Aboriginal Land
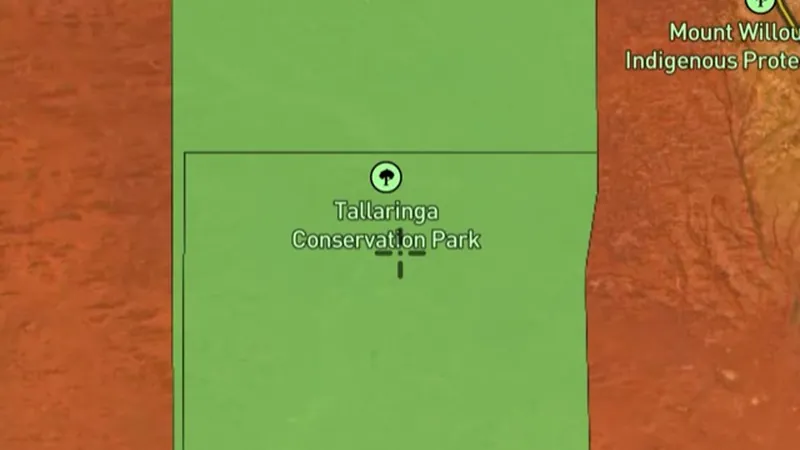
  • National, Recreation and Conservation Parks in the Detector Maps app, South Australia© Mapbox, © Maxar
    Land Use & AccessExplorer

    National, Recreation and Conservation Parks

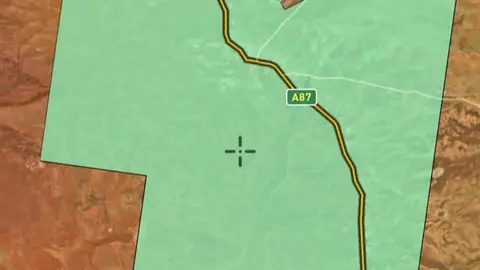
    Park and reserve boundaries.

    Read the write-up
    National, Recreation and Conservation Parks in the Detector Maps app, South Australia© Mapbox, © Maxar

    A screen from the Detector Maps app. Satellite imagery © Mapbox, © Maxar.

    Explorer. Opens with Explorer or Pro. On the Free plan it works inside your one free area of 250 km².

    Open in the app

    About this layer

    These boundaries show parks, reserves or conservation areas. They help you identify the land manager and areas that need further access checks. A park boundary alone does not tell you which activities are permitted there.

    What it is for

    Turn on the relevant layers together and read their legends and notes. Check current conditions with the land manager before planning a visit.

    Limits

    An unshaded area is not automatically available for detecting. Different permissions and restrictions can overlap.

    Source

    Data provided by the State of South Australia (The Department for Energy and Mining 2024, Department for Housing and Urban Development 2024, Deparment of Environment and Water 2024), licensed under CC BY 4.0

    Legend

    National, Recreation and Conservation Parks
    • National Park (NP)
    • Conservation Park (CP)
    • Conservation Reserve (CR)
    • Game Reserve (GR)
    • Recreation Park (RP)
    • Regional Reserve (RR)
    • Wilderness Area (WA)
  • Parks - No Mining or Exploration in the Detector Maps app, South Australia© Mapbox, © Maxar
    Land Use & AccessExplorer

    Parks - No Mining or Exploration

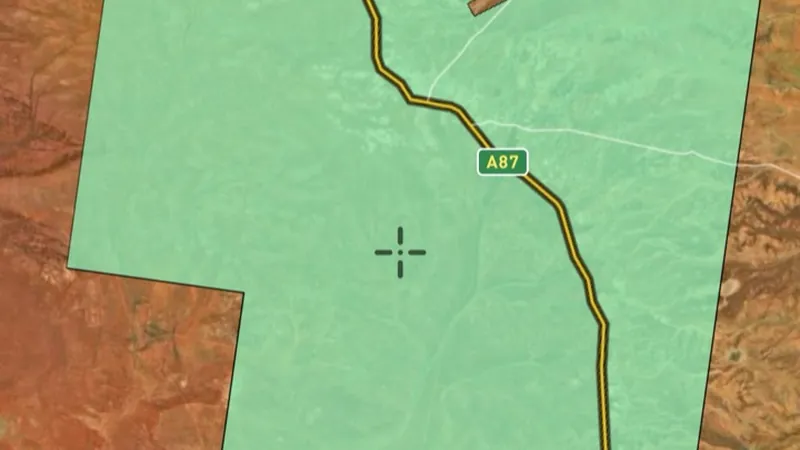
    Park areas where mining and exploration are not allowed. Off-limits to fossickers.

    Read the write-up
    Parks - No Mining or Exploration in the Detector Maps app, South Australia© Mapbox, © Maxar

    A screen from the Detector Maps app. Satellite imagery © Mapbox, © Maxar.

    Explorer. Opens with Explorer or Pro. On the Free plan it works inside your one free area of 250 km².

    Open in the app

    About this layer

    These boundaries show parks, reserves or conservation areas. They help you identify the land manager and areas that need further access checks. A park boundary alone does not tell you which activities are permitted there.

    What it is for

    Turn on the relevant layers together and read their legends and notes. Check current conditions with the land manager before planning a visit.

    Limits

    An unshaded area is not automatically available for detecting. Different permissions and restrictions can overlap.

    Source

    Data provided by the State of South Australia (The Department for Energy and Mining 2024, Department for Housing and Urban Development 2024, Deparment of Environment and Water 2024), licensed under CC BY 4.0

    Legend

    Parks - No Mining or Exploration
    • No Mining or Exploration
  • Parks - Restricted Mining or Exploration in South Australia, drawn over satellite imagery© Mapbox, © Maxar
    Land Use & AccessExplorer

    Parks - Restricted Mining or Exploration

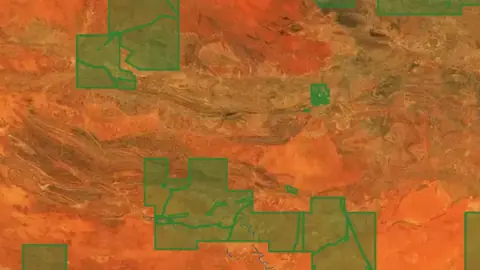
    Park areas with restricted mining or exploration. Check the conditions.

    Read the write-up
    Parks - Restricted Mining or Exploration in South Australia, drawn over satellite imagery© Mapbox, © Maxar

    The layer drawn over satellite imagery. Satellite imagery © Mapbox, © Maxar.

    Explorer. Opens with Explorer or Pro. On the Free plan it works inside your one free area of 250 km².

    Open in the app

    About this layer

    These boundaries show parks, reserves or conservation areas. They help you identify the land manager and areas that need further access checks. A park boundary alone does not tell you which activities are permitted there.

    What it is for

    Turn on the relevant layers together and read their legends and notes. Check current conditions with the land manager before planning a visit.

    Limits

    An unshaded area is not automatically available for detecting. Different permissions and restrictions can overlap.

    Source

    Data provided by the State of South Australia (The Department for Energy and Mining 2024, Department for Housing and Urban Development 2024, Deparment of Environment and Water 2024), licensed under CC BY 4.0

    Legend

    Parks - Restricted Mining or Exploration
    • Restricted Mining or Exploration
  • Pastoral Stations in the Detector Maps app, South Australia© Mapbox, © Maxar
    Land Use & AccessExplorer

    Pastoral Stations

    Pastoral lease boundaries. Permission from the station lessee is typically required.

    Read the write-up
    Pastoral Stations in the Detector Maps app, South Australia© Mapbox, © Maxar

    A screen from the Detector Maps app. Satellite imagery © Mapbox, © Maxar.

    Explorer. Opens with Explorer or Pro. On the Free plan it works inside your one free area of 250 km².

    Open in the app

    About this layer

    Pastoral station boundaries help identify grazing properties around your research area. Compare them with mining and land-access layers before planning a trip. A station boundary does not provide permission to enter or prospect.

    What it is for

    Turn on the relevant layers together and read their legends and notes. Check current conditions with the land manager before planning a visit.

    Limits

    An unshaded area is not automatically available for detecting. Different permissions and restrictions can overlap.

    Source

    Data provided by the State of South Australia (The Department for Energy and Mining 2024, Department for Housing and Urban Development 2024, Deparment of Environment and Water 2024), licensed under CC BY 4.0

    Legend

    Pastoral Stations
    • Pastoral Stations
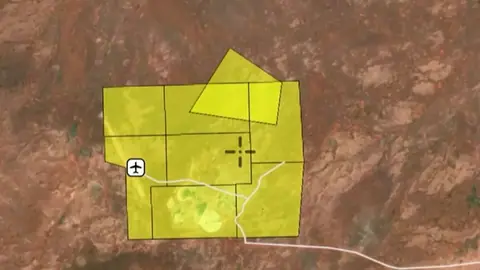
  • Precious Stones Fields in the Detector Maps app, South Australia© Mapbox, © Maxar
    Land Use & AccessExplorer

    Precious Stones Fields

    Declared precious stone fields (e.g. opal). Specific rules apply.

    Read the write-up
    Precious Stones Fields in the Detector Maps app, South Australia© Mapbox, © Maxar

    A screen from the Detector Maps app. Satellite imagery © Mapbox, © Maxar.

    Explorer. Opens with Explorer or Pro. On the Free plan it works inside your one free area of 250 km².

    Open in the app

    About this layer

    These are mapped fossicking or recreational prospecting areas. Open the area details and check the permitted activities, boundaries and conditions before visiting. Rules can vary between sites and between panning, detecting and other equipment.

    What it is for

    Turn on the relevant layers together and read their legends and notes. Check current conditions with the land manager before planning a visit.

    Limits

    An unshaded area is not automatically available for detecting. Different permissions and restrictions can overlap.

    Source

    Data provided by the State of South Australia (The Department for Energy and Mining 2024, Department for Housing and Urban Development 2024, Deparment of Environment and Water 2024), licensed under CC BY 4.0

    Legend

    Precious Stones Fields
    • Precious Stones Fields

Native Title Areas

3
  • NT Determinations in South Australia, drawn over satellite imagery© Mapbox, © Maxar
    Native Title AreasExplorer

    NT Determinations

    Native title determinations record decisions about whether native title exists in an area.

    Also in 5 other states in Australia
    Read the write-up
    NT Determinations in South Australia, drawn over satellite imagery© Mapbox, © Maxar

    The layer drawn over satellite imagery. Satellite imagery © Mapbox, © Maxar.

    Explorer. Opens with Explorer or Pro. On the Free plan it works inside your one free area of 250 km².

    Open in the app

    This layer works the same way in 6 places in Australia, so its full write-up, legend and plan are on one page.

    Read the full write-up

    Source in South Australia

    Data provided by the State of South Australia (The Department for Energy and Mining 2024, Department for Housing and Urban Development 2024, Deparment of Environment and Water 2024), licensed under CC BY 4.0

  • NT Claims in South Australia, drawn over satellite imagery© Mapbox, © Maxar
    Native Title AreasExplorer

    NT Claims

    Native title claims show areas covered by applications to recognise native title rights.

    Also in 5 other states in Australia
    Read the write-up
    NT Claims in South Australia, drawn over satellite imagery© Mapbox, © Maxar

    The layer drawn over satellite imagery. Satellite imagery © Mapbox, © Maxar.

    Explorer. Opens with Explorer or Pro. On the Free plan it works inside your one free area of 250 km².

    Open in the app

    This layer works the same way in 6 places in Australia, so its full write-up, legend and plan are on one page.

    Read the full write-up

    Source in South Australia

    Data provided by the State of South Australia (The Department for Energy and Mining 2024, Department for Housing and Urban Development 2024, Deparment of Environment and Water 2024), licensed under CC BY 4.0

  • ILUA in South Australia, drawn over satellite imagery© Mapbox, © Maxar
    Native Title AreasExplorer

    ILUA

    An Indigenous Land Use Agreement, or ILUA, is an agreement about land or waters and their use.

    Also in 5 other states in Australia
    Read the write-up
    ILUA in South Australia, drawn over satellite imagery© Mapbox, © Maxar

    The layer drawn over satellite imagery. Satellite imagery © Mapbox, © Maxar.

    Explorer. Opens with Explorer or Pro. On the Free plan it works inside your one free area of 250 km².

    Open in the app

    This layer works the same way in 6 places in Australia, so its full write-up, legend and plan are on one page.

    Read the full write-up

    Source in South Australia

    Data provided by the State of South Australia (The Department for Energy and Mining 2024, Department for Housing and Urban Development 2024, Deparment of Environment and Water 2024), licensed under CC BY 4.0

Historic Mining Leases

1
  • Historic Mining Leases in the Detector Maps app, South Australia© Mapbox, © Maxar
    Historic Mining LeasesExplorer

    Historic Mining Leases

    Footprints of expired mining leases. Shows where past mining was concentrated.

    Read the write-up
    Historic Mining Leases in the Detector Maps app, South Australia© Mapbox, © Maxar

    A screen from the Detector Maps app. Satellite imagery © Mapbox, © Maxar.

    Explorer. Opens with Explorer or Pro. On the Free plan it works inside your one free area of 250 km².

    Open in the app

    About this layer

    Historic claims and leases show where mineral rights were recorded in the past. They can help you trace earlier exploration and mining interest. An expired or historical record does not mean the land is now open.

    What it is for

    Compare historic activity with current tenure, geology and access layers when researching an area.

    Limits

    An expired or closed record does not mean land is now open. Check current records and permissions separately.

    Source

    Data provided by the State of South Australia (The Department for Energy and Mining 2024, Department for Housing and Urban Development 2024, Deparment of Environment and Water 2024), licensed under CC BY 4.0

    Legend

    Historic Mining Leases
    • Historic Mining Leases

Property Boundaries

1
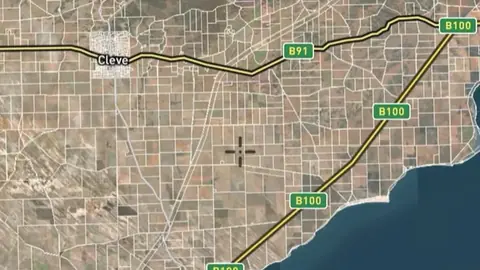
  • Property Boundaries in the Detector Maps app, South Australia© Mapbox, © Maxar
    Property BoundariesExplorer

    Property Boundaries

    Parcel boundaries showing private vs public land.

    Read the write-up
    Property Boundaries in the Detector Maps app, South Australia© Mapbox, © Maxar

    A screen from the Detector Maps app. Satellite imagery © Mapbox, © Maxar.

    Explorer. Opens with Explorer or Pro. On the Free plan it works inside your one free area of 250 km².

    Open in the app

    About this layer

    Property boundaries show how the land is divided into parcels. Use the outlines to identify the land you want to research and check the available parcel details. A boundary does not give permission to enter or establish a public route.

    What it is for

    Use the outlines to identify the parcel you want to research, then check the relevant land records and access arrangements.

    Limits

    Map boundaries can be approximate. A parcel outline does not identify a public route or give permission to enter.

    Source

    Data provided by the State of South Australia (The Department for Energy and Mining 2024, Department for Housing and Urban Development 2024, Deparment of Environment and Water 2024), licensed under CC BY 4.0

    Legend

    Property Boundaries
    • Property Boundaries

Water & Streams

1
  • Waterways in the Detector Maps app, South Australia© Mapbox, © Maxar
    Water & StreamsExplorer

    Waterways

    Waterways show the mapped routes of rivers, creeks and drainage lines.

    Read the write-up
    Waterways in the Detector Maps app, South Australia© Mapbox, © Maxar

    A screen from the Detector Maps app. Satellite imagery © Mapbox, © Maxar.

    Explorer. Opens with Explorer or Pro. On the Free plan it works inside your one free area of 250 km².

    Open in the app

    About this layer

    Waterways show the mapped routes of rivers, creeks and drainage lines. Follow their connections and compare them with terrain when researching how sediment moves. A mapped waterway may be dry or altered, and does not establish access.

    What it is for

    Follow drainage connections and compare them with terrain. Read the selected layer name and legend to distinguish feature types.

    Limits

    A mapped waterway may be dry, altered or difficult to cross. It does not establish access or permission to work in the waterway.

    Source

    Data provided by the State of South Australia (The Department for Energy and Mining 2024, Department for Housing and Urban Development 2024, Deparment of Environment and Water 2024), licensed under CC BY 4.0

    Legend

    Water & Streams
    • Watercourses
    • Waterbodies

Bushfires

1
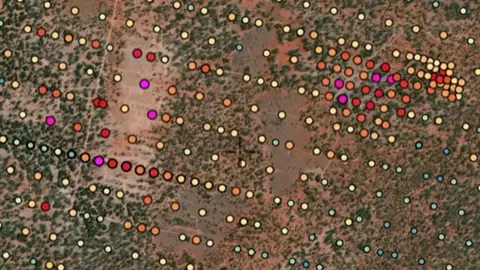
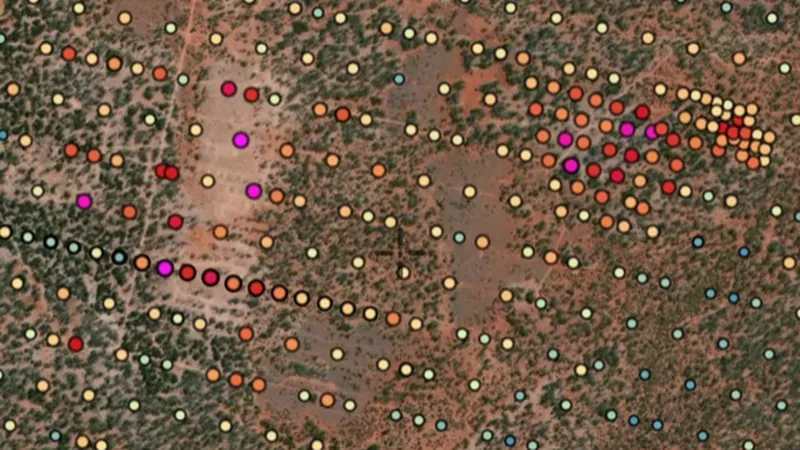
  • Active Fires (10 min updates) in the Detector Maps app, South Australia© Mapbox, © Maxar
    BushfiresExplorer

    Active Fires (10 min updates)

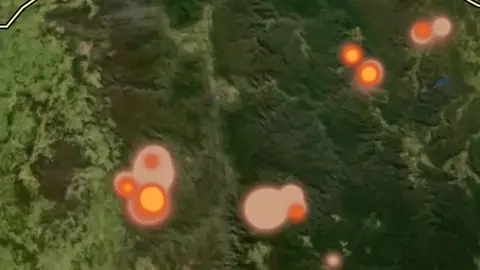
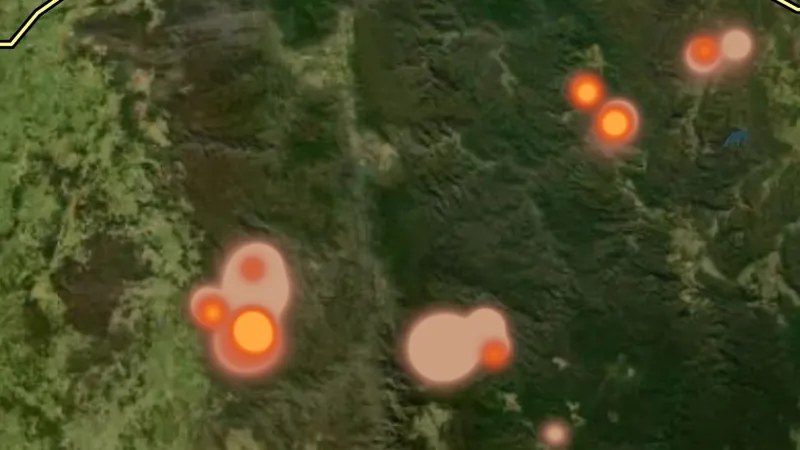
    Where satellites saw fire in the last three days, drawn as a glow: brighter for fiercer fires, coloured by how recently the heat was seen.

    Also in 6 other states in Australia
    Read the write-up
    Active Fires (10 min updates) in the Detector Maps app, South Australia© Mapbox, © Maxar

    A screen from the Detector Maps app. Satellite imagery © Mapbox, © Maxar.

    Explorer. Opens with Explorer or Pro. On the Free plan it works inside your one free area of 250 km².

    Open in the app

    This layer works the same way in 7 places in Australia, so its full write-up, legend and plan are on one page.

    Read the full write-up

    Source in South Australia

    Geoscience Australia DEA Hotspots

    Draws from zoom 3.

Geology

2
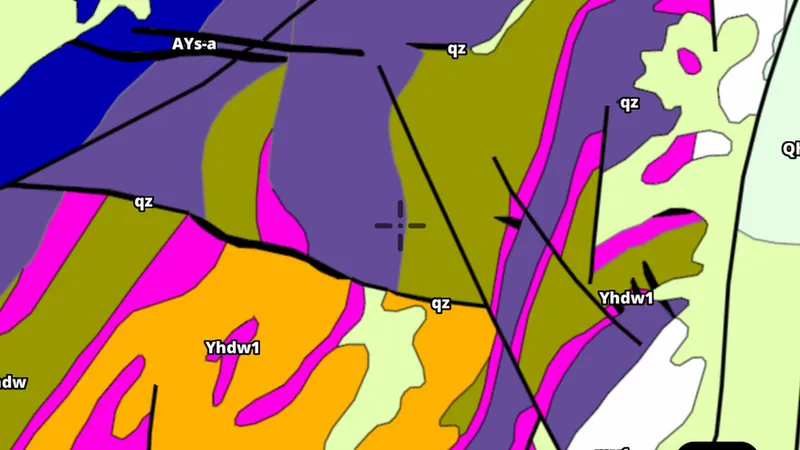
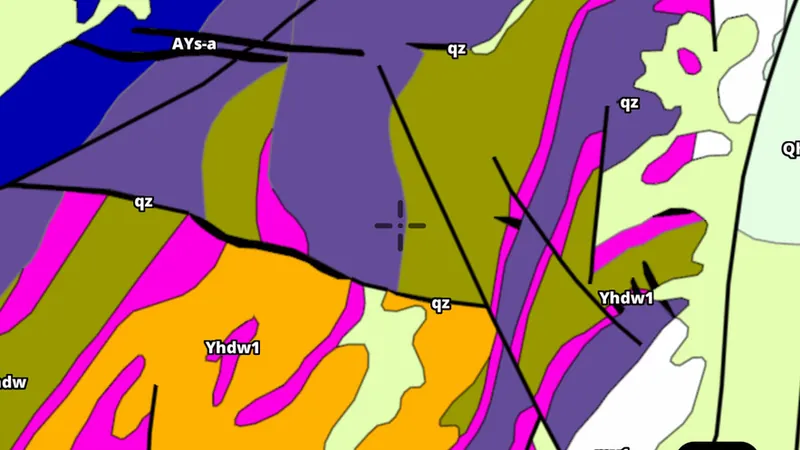
  • Geology Seamless 100k in the Detector Maps app, South Australia© Mapbox, © Maxar
    GeologyExplorer

    Geology Seamless 100k

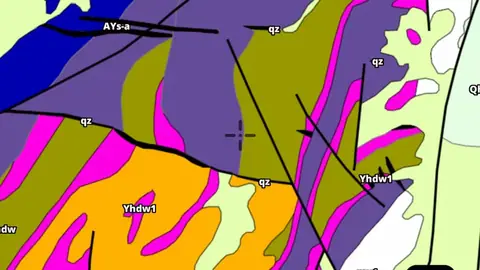
    Detailed 1:100,000 surface rock unit polygons, coloured by lithology and age.

    Read the write-up
    Geology Seamless 100k in the Detector Maps app, South Australia© Mapbox, © Maxar

    A screen from the Detector Maps app. Satellite imagery © Mapbox, © Maxar.

    Explorer. Opens with Explorer or Pro. On the Free plan it works inside your one free area of 250 km².

    Open in the app

    About this layer

    Geological maps divide the ground into rock or sediment units. Colours and patterns tell you which mapped unit is present; use the legend to read them. Compare the boundaries with mineral records, without assuming one rock type guarantees gold.

    What it is for

    Use the legend to identify colours and line symbols. Compare rock boundaries and structures with mineral records and terrain.

    Limits

    Geological maps simplify the ground at their stated scale. Boundaries are interpretations and may not match what is exposed at the surface.

    Source

    Data provided by the State of South Australia (The Department for Energy and Mining 2024, Department for Housing and Urban Development 2024, Deparment of Environment and Water 2024), licensed under CC BY 4.0

    Filters in the app

    Attribute filtersGold host rocks filter
  • Geology Structure 100k in the Detector Maps app, South Australia© Mapbox, © Maxar
    GeologyExplorer

    Geology Structure 100k

    Faults, joints and folds at 1:100,000: the structural framework that often guides mineralisation.

    Read the write-up
    Geology Structure 100k in the Detector Maps app, South Australia© Mapbox, © Maxar

    A screen from the Detector Maps app. Satellite imagery © Mapbox, © Maxar.

    Explorer. Opens with Explorer or Pro. On the Free plan it works inside your one free area of 250 km².

    Open in the app

    About this layer

    Geological structures show mapped features such as faults, folds, veins and the direction of rock layers. Compare their pattern with nearby mineral records. A mapped line is a geological clue, not a confirmed line of gold.

    What it is for

    Use the legend to identify colours and line symbols. Compare rock boundaries and structures with mineral records and terrain.

    Limits

    Geological maps simplify the ground at their stated scale. Boundaries are interpretations and may not match what is exposed at the surface.

    Source

    Data provided by the State of South Australia (The Department for Energy and Mining 2024, Department for Housing and Urban Development 2024, Deparment of Environment and Water 2024), licensed under CC BY 4.0

Geophysics

2
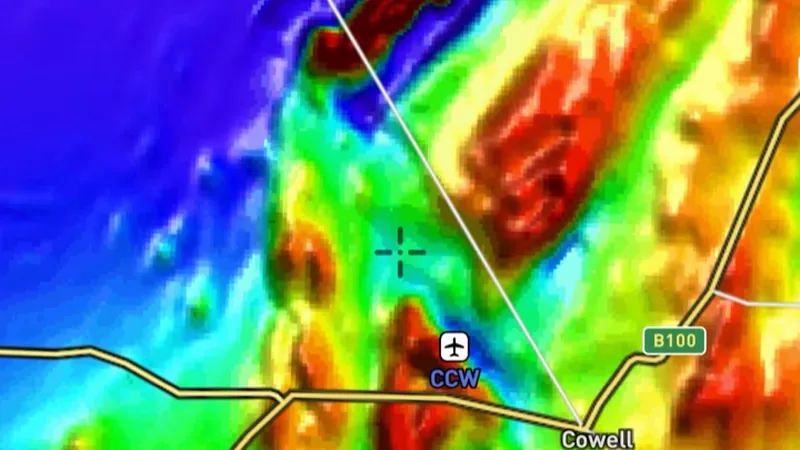
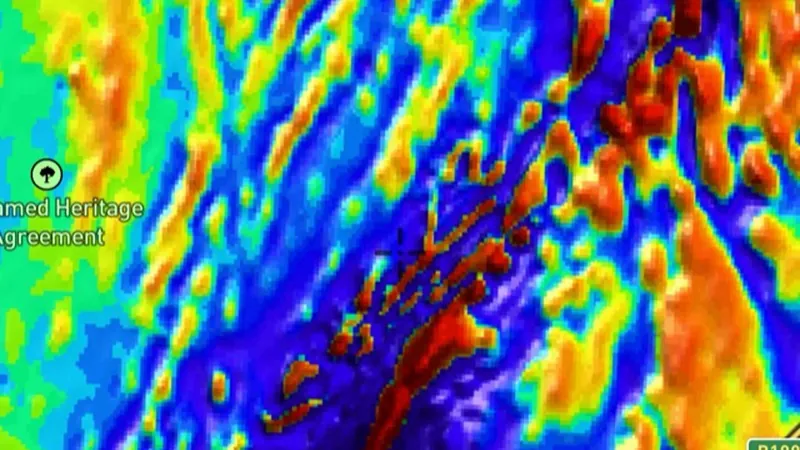
  • Total Magnetic Intensity (RTP) in the Detector Maps app, South Australia© Mapbox, © Maxar
    GeophysicsExplorer

    Total Magnetic Intensity (RTP)

    Variable-reduction-to-pole magnetics revealing subsurface magnetic features and trends.

    Read the write-up
    Total Magnetic Intensity (RTP) in the Detector Maps app, South Australia© Mapbox, © Maxar

    A screen from the Detector Maps app. Satellite imagery © Mapbox, © Maxar.

    Explorer. Opens with Explorer or Pro. On the Free plan it works inside your one free area of 250 km².

    Open in the app

    About this layer

    This magnetic survey image highlights differences in the magnetic properties of the ground. RTP means the data has been adjusted to make magnetic features easier to relate to their sources. Compare broad bands and changes with the geology; it does not detect gold directly.
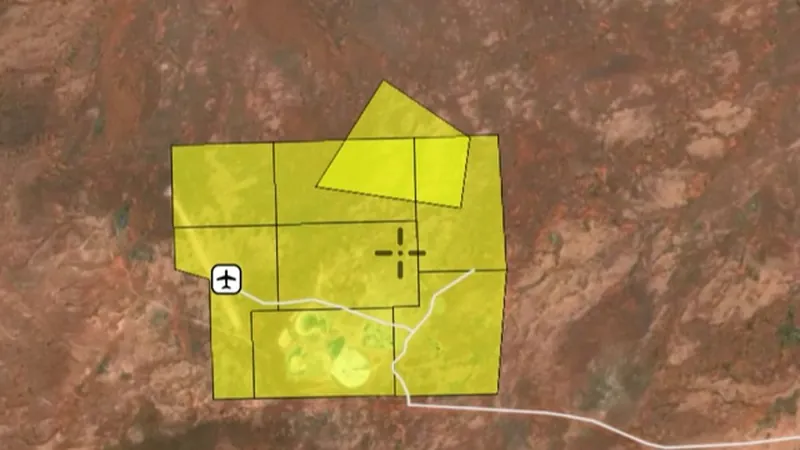
    What it is for

    Compare broad patterns and boundaries with mapped geology. Check which magnetic processing option is selected.

    Limits

    Magnetic highs and lows do not directly measure gold. Survey processing can emphasise different parts of the same signal.

    Source

    Data provided by the State of South Australia (The Department for Energy and Mining 2024, Department for Housing and Urban Development 2024, Deparment of Environment and Water 2024), licensed under CC BY 4.0

  • Total Magnetic Intensity (RTP 1VD) in the Detector Maps app, South Australia© Mapbox, © Maxar
    GeophysicsExplorer

    Total Magnetic Intensity (RTP 1VD)

    First vertical derivative showing shallow magnetic edges and contacts.

    Read the write-up
    Total Magnetic Intensity (RTP 1VD) in the Detector Maps app, South Australia© Mapbox, © Maxar

    A screen from the Detector Maps app. Satellite imagery © Mapbox, © Maxar.

    Explorer. Opens with Explorer or Pro. On the Free plan it works inside your one free area of 250 km².

    Open in the app

    About this layer

    This magnetic view emphasises changes and edges in the survey data. The abbreviation 1VD means first vertical derivative. Compare its sharper lines with the broader RTP image and geology, rather than treating every bright edge as a gold target.

    What it is for

    Compare broad patterns and boundaries with mapped geology. Check which magnetic processing option is selected.

    Limits

    Magnetic highs and lows do not directly measure gold. Survey processing can emphasise different parts of the same signal.

    Source

    Data provided by the State of South Australia (The Department for Energy and Mining 2024, Department for Housing and Urban Development 2024, Deparment of Environment and Water 2024), licensed under CC BY 4.0

Basemap

1
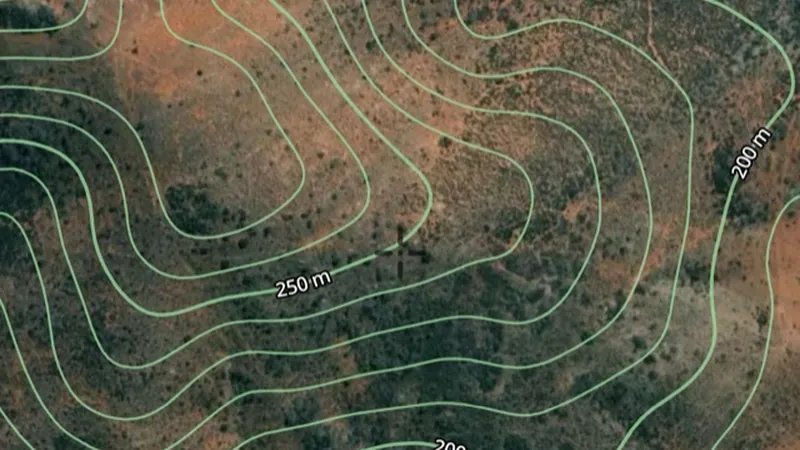
  • Contours in the Detector Maps app, South Australia© Mapbox, © Maxar
    BasemapExplorer

    Contours

    Elevation lines showing slope and shape.

    Also in 2 other states in Australia
    Read the write-up
    Contours in the Detector Maps app, South Australia© Mapbox, © Maxar

    A screen from the Detector Maps app. Satellite imagery © Mapbox, © Maxar.

    Explorer. Opens with Explorer or Pro. On the Free plan it works inside your one free area of 250 km².

    Open in the app

    This layer works the same way in 3 places in Australia, so its full write-up, legend and plan are on one page.

    Read the full write-up

    Source in South Australia

    Data provided by the State of South Australia (The Department for Energy and Mining 2024, Department for Housing and Urban Development 2024, Deparment of Environment and Water 2024), licensed under CC BY 4.0

All Mineral Occurrences
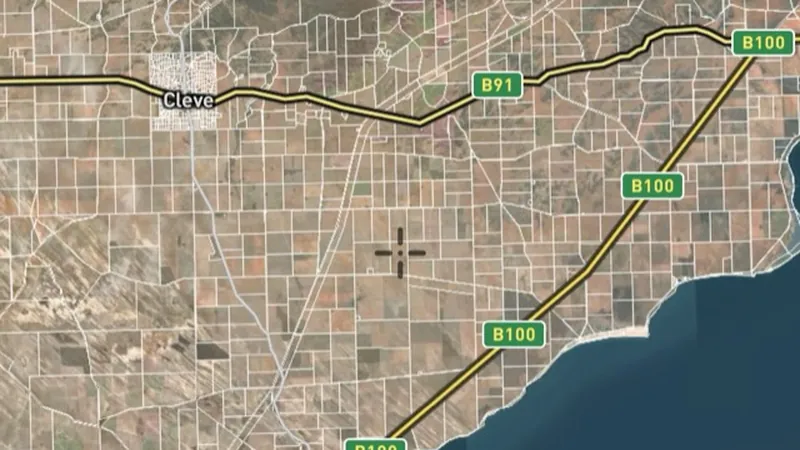
1
  • All Mineral Occurrences in South Australia, drawn over satellite imagery© Mapbox, © Maxar
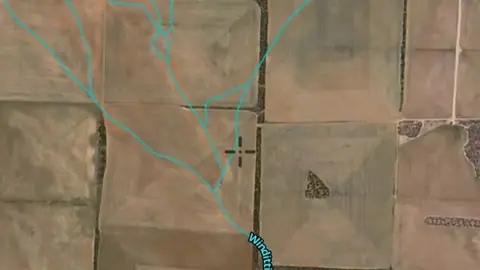
    All Mineral OccurrencesPro

    All Mineral Occurrences
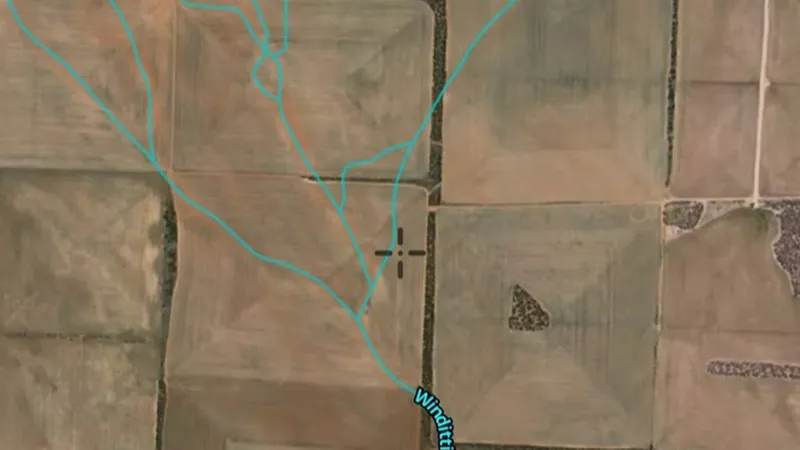
    Official records of mineral occurrences for every commodity, not just gold. Use the commodity filter to show a single commodity.
    Also in 6 other states in Australia
    Read the write-up
    All Mineral Occurrences in South Australia, drawn over satellite imagery© Mapbox, © Maxar
    The layer drawn over satellite imagery. Satellite imagery © Mapbox, © Maxar.

    Pro. Opens with Pro.

    Open in the app

    This layer works the same way in 7 places in Australia, so its full write-up, legend and plan are on one page.

    Read the full write-up

    Source in South Australia

    Data provided by the State of South Australia (The Department for Energy and Mining 2024, Department for Housing and Urban Development 2024, Deparment of Environment and Water 2024), licensed under CC BY 4.0

    Filters in the app

    Attribute filters
Sources

Where the data comes from.

Every card names its source. The sources named on this page are:

  • Data provided by the State of South Australia (The Department for Energy and Mining 2024, Department for Housing and Urban Development 2024, Deparment of Environment and Water 2024), licensed under CC BY 4.0 CC BY 4.0
  • Geoscience Australia DEA Hotspots

Satellite imagery © Mapbox, © Maxar. Layer data from the sources named on each card.

Plans

What the pills mean.

Every layer shows the plan that opens it. The free plan never runs out. Prices are shown once, here.

Free

Open on every plan, forever. Includes gold records.

Explorer

Opens every base layer, and offline maps for the areas you choose. A$99 a year or A$9.99 a month.

Pro

Tenement alerts for a drawn area or a whole state. Report search across decades of exploration reports. A$249 a year or A$34.99 a month.

Add-on

A layer sold on its own: the Victorian LiDAR add-on, A$39.99 a year.

7-day free trial on yearly plans · Nothing charged until it ends · Cancel anytime.

Satellite imagery © Mapbox, © Maxar. Layer data from the sources named on each card.

Get Detector Maps

Plan the next trip tonight.

Free to download on iPhone and Android.

On iPhone? Get it on the App StoreOn Android? Get it on Google Play

Free to download on iPhone and Android.

7-day free trial on yearly plans · Nothing charged until it ends · Cancel anytime.

Scan with your phone camera to get the app
Start free trialOpen the web map

On your phone: App Store · Google Play

7-day free trial on yearly plans · Nothing charged until it ends · Cancel anytime.

Or open the web map

The Detector Maps support inbox is staffed by Matt and Tom, the two brothers who built it. Contact us

Scan with your phone camera to get the app