Active Fires (10 min updates)
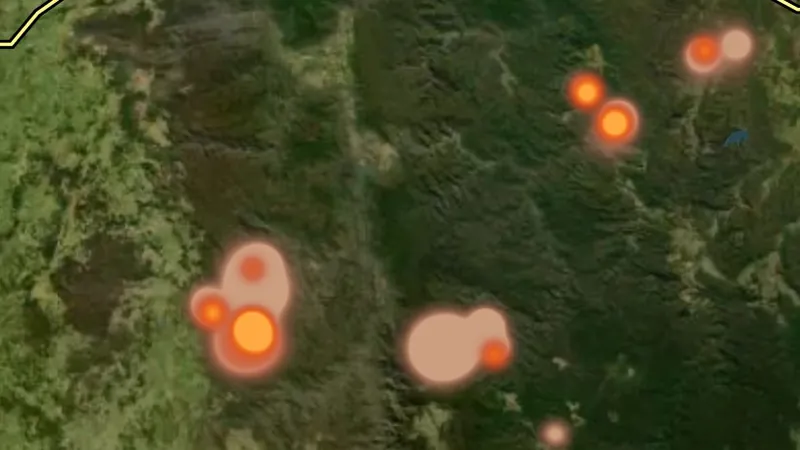
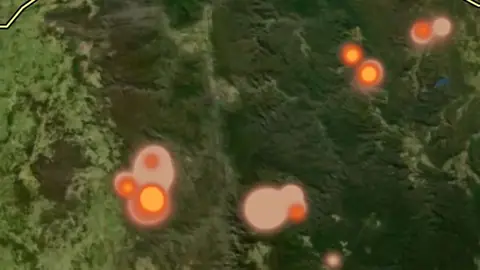
Where satellites saw fire in the last three days, drawn as a glow: brighter for fiercer fires, coloured by how recently the heat was seen.
On iPhone? Get it on the App StoreOn Android? Get it on Google Play
Free to download on iPhone and Android.
7-day free trial on yearly plans · Nothing charged until it ends · Cancel anytime.
On your phone: App Store · Google Play
7-day free trial on yearly plans · Nothing charged until it ends · Cancel anytime.
 © Mapbox, © Maxar
Satellite imagery © Mapbox, © Maxar. Layer data from the sources named on each card.
About this layer
Where satellites saw fire in the last three days, from Geoscience Australia's national hotspot service. Himawari-9 looks every ten minutes and the VIIRS and MODIS sensors add sharper fixes as they pass, so the map is a rolling three-day picture of the whole country. Heat draws as a glow rather than a pin. Colour is how recently it was seen: white-gold within the last few hours, orange within the day, ash for ground last hot days ago, so the bright edge of a fire is where it is moving now. Brightness is how much heat was measured there, added up over every pass, so a fire seen on many passes glows as strongly as a fierce one seen twice. A lone wide, soft glow is heat the satellite could only place to about two kilometres; a tight one is good to a few hundred metres, though many tight fixes merge into a wide glow too. Use the two sliders on the filter card to keep only recent or precisely placed heat, and tap a glow for when it was first and last seen, how many passes reported it and how fierce it was.
What it is for
Check the layer time period and legend. Use the responsible fire agency for current warnings and closures.
Limits
These map records are not live emergency advice. Missing or old records cannot establish that an area is safe.
Where it works in Australia.
Drawn in each state.
 © Mapbox, © MaxarNew South Wales Explorer
 © Mapbox, © MaxarNorthern Territory Explorer
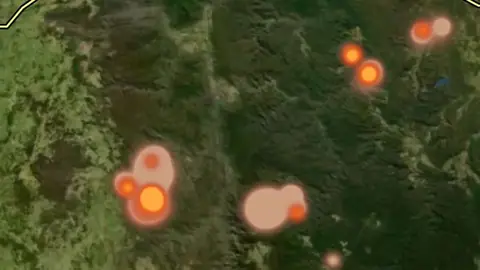 © Mapbox, © MaxarQueensland Explorer
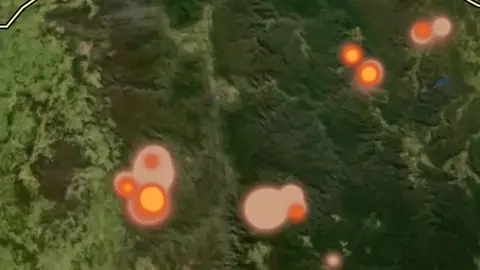 © Mapbox, © MaxarSouth Australia Explorer
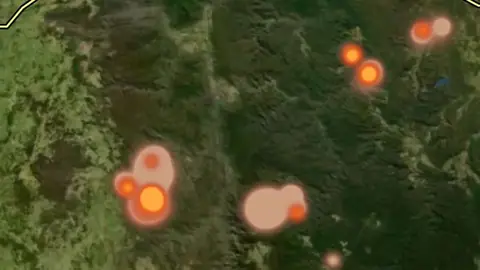 © Mapbox, © MaxarTasmania Explorer
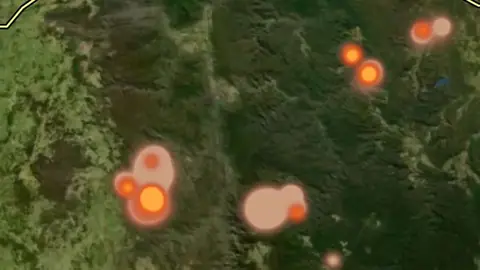 © Mapbox, © MaxarVictoria Explorer
 © Mapbox, © MaxarWestern Australia Explorer
Satellite imagery © Mapbox, © Maxar. Layer data from the sources named on each card.
Where the data comes from.
Geoscience Australia DEA Hotspots
How it is drawn.
- Seen in the last 6 hours
- 6 to 24 hours ago
- 1 to 3 days ago
Draws from zoom 3.
What the pills mean.
Every layer shows the plan that opens it. The free plan never runs out. Prices are shown once, here.
Open on every plan, forever. Includes gold records.
Opens every base layer, and offline maps for the areas you choose. A$99 a year or A$9.99 a month.
Tenement alerts for a drawn area or a whole state. Report search across decades of exploration reports. A$249 a year or A$34.99 a month.
A layer sold on its own: the Victorian LiDAR add-on, A$39.99 a year.
7-day free trial on yearly plans · Nothing charged until it ends · Cancel anytime.
Satellite imagery © Mapbox, © Maxar. Layer data from the sources named on each card.
Plan the next trip tonight.
Free to download on iPhone and Android.
On iPhone? Get it on the App StoreOn Android? Get it on Google Play
Free to download on iPhone and Android.
7-day free trial on yearly plans · Nothing charged until it ends · Cancel anytime.
On your phone: App Store · Google Play
7-day free trial on yearly plans · Nothing charged until it ends · Cancel anytime.
The Detector Maps support inbox is staffed by Matt and Tom, the two brothers who built it. Contact us